El estrés y la tensión son dos de los conceptos más importantes para describir cómo responden los materiales a las fuerzas. El estrés es la fuerza interna por unidad de área dentro de un material bajo carga, mientras que la tensión es la deformación o el cambio de forma del material que resulta de la fuerza aplicada.
Sin embargo, la relación entre el estrés y la tensión va mucho más allá de la teoría: es esencial para las decisiones de ingeniería de sonido. Al compararlos uno al lado del otro, podemos predecir mejor cómo funcionan los materiales, cuánto pueden deformarse de manera segura y cuándo pueden fallar. Este artículo explora sus definiciones, diferencias, relaciones y aplicaciones prácticas.
Antes de entrar en los detalles, puede encontrar este breve video introductorio sobre el estrés y la tensión útil:
¿Qué es el estrés?
El estrés es la fuerza interna por unidad de área que desarrolla un material para resistir una carga externa. Microscópicamente, la carga aplicada induce fuerzas interatómicas que se oponen a la deformación y "mantienen" la estructura juntas; Esta resistencia interna es lo que medimos como estrés.
Dependiendo de cómo se aplique la carga, el estrés se clasifica como:
Estrés por tracción (σT) y tensión de compresión (σdo)Estas son tensiones normales que actúan perpendiculares al área de la sección transversal.
Tensión cortante (τ):Causado por fuerzas tangenciales que actúan paralela al área de la sección transversal.
Estrés torsional (τT)Una forma específica de tensión cortante inducida por torque o torsión.
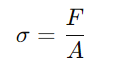
Entre ellos, el estrés por tracción es el tipo de estrés más fundamental en el diseño de ingeniería. La fórmula de cálculo es:
Dónde:
σ = estrés (PA o N/m²; a veces psi)
F = fuerza aplicada (n)
A = el área de sección transversal original sobre la cual se aplica la fuerza (m²)
Cómo se mide el estrés de los materiales
La medición del estrés directamente no es posible, por lo que, en cambio, debemos medir las fuerzas aplicadas o las deformaciones resultantes. A continuación se muestra una visión general concisa de las técnicas de medición clave:
Método / tecnología
Principio
Dispositivo de medición / herramienta
Precisión y precisión
Aplicaciones comunes
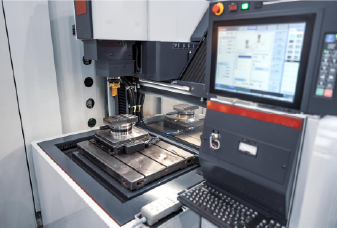
Máquina de prueba universal (UTM)
Mide la fuerza (f), calcula el estrés = f/a
UTM con celda de carga integrada
★★★★★ (alta precisión)
Prueba de material fundamental: curvas de tensión-deformación, evaluación de propiedades mecánicas
Calibre
Mide la tensión (ε), calcula el estrés a través de σ = e · ε (supone la elasticidad lineal)
Sistema de adquisición de datos, sistema de adquisición de datos
★★★★ ☆ (alto)
Análisis de estrés por componente; evaluación de fatiga; monitoreo estructural integrado
Extensómetro
Mide el cambio de calibre-longitud, calcula ε y σ
Extensómetros de contacto o sin contacto
★★★★ ☆ (alto)
Prueba de tracción de muestras; verificación del módulo elástico y tensión de rendimiento
Correlación de imagen digital (DIC)
Método óptico, rastrea la deformación de la superficie de campo completo
Sistema de cámara de alta velocidad, software DIC
★★★★ ☆ (campo completo)
Análisis de tensión de campo completo; seguimiento de grietas; Estudios de inhomogeneidad material
Medición del estrés ultrasónico
Utiliza cambios de velocidad de onda en los materiales bajo estrés
Sonda ultrasónica y receptor
★★★ ☆☆ (moderado)
Detección de estrés residual; Monitoreo de tensión en articulaciones soldadas y grandes estructuras
Difracción de rayos X (XRD)
Mide la distorsión de la red causada por el estrés interno
Difractómetro XRD, software especializado
★★★★ ☆ (alta precisión; localizada en capas superficiales)
Películas delgadas, zonas de soldadura, estrés residual de la superficie en metales y cerámica
Fotoelasticidad
Visualiza el estrés a través de las franjas de interferencia óptica en materiales birrefringentes transparentes
Configuración de luz polarizada y modelos de polímeros birrefringentes
★★★ ☆☆ (cualitativo a semifantitativo)
Demostraciones educativas; Análisis de estrés experimental en modelos transparentes
Técnicas de caracterización a micro/nanoescala
Técnicas como EBSD, Micro-Raman, Nanoindación proporcionan mapeo de tensión/tensión de micro o nanoescala
Sistemas basados en electrones o láser, software de análisis de imágenes
Microelectrónica, películas delgadas, nanoindentación, comportamiento de interfaz compuesta
¿Qué es la tensión?
La cepa es una medida de la deformación relativa que sufre un material cuando se somete a una fuerza externa. Se expresa como una cantidad sin unidad o como un porcentaje, lo que representa el cambio de longitud (u otras dimensiones) a la longitud original (o dimensión).
El tipo de deformación corresponde al estrés aplicado: tensión de tracción, tensión de compresión o tensión de corte.
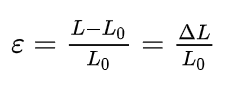
La fórmula para la tensión normal es:
Dónde:
ϵ = cepa (dimensiva o expresada en %)
ΔL = Cambio de longitud
L0= Longitud original
Cómo se mide la tensión de los materiales
Se pueden usar varios métodos para medir la tensión. Las técnicas más utilizadas son los medidores de tensión y los extensómetros. La siguiente tabla resume los métodos comunes para medir la tensión en los materiales:
Método
Principio de detección
Sensor / transductor
Escenario de medición
Observaciones
Calibre
Cambio de resistencia
Calibre de tensión de tipo de lámina
Tensión estática o de baja frecuencia; comúnmente usado
Ampliamente utilizado en la industria; bajo costo; Requiere conexiones adhesivas y conexiones de cableado
Extensómetro
Desplazamiento
Extensómetro de clip-on / contacto
Prueba de material; Medición de la sección completa
Alta precisión; inadecuado para pruebas dinámicas o tensión altamente localizada
Correlación de imagen digital (DIC)
Seguimiento óptico
Cámara + patrón de moteos
Mapeo de tensión de campo completo; propagación de grietas; especímenes de forma compleja
Sin contacto; Mapeo de deformación 2D/3D; sistema costoso
Sensor piezoeléctrico
Efecto piezoeléctrico
Película piezoeléctrica o cristal
Tensión dinámica, presión, impacto, vibración
Respuesta de alta frecuencia; inadecuado para mediciones de tensión estática
Fiber Bragg rejilla (FBG)
Óptico (reflexión de Bragg)
Sensor de fibra óptica FBG
Medición distribuida o multiplexada a largas distancias
Inmune a EMI; Adecuado para estructuras aeroespaciales, de energía e inteligentes
Vibrómetro Doppler láser (LDV)
Efecto doppler
Sonda láser de LDV
Medición dinámica de tensión/velocidad y análisis de vibración superficial
Sin contacto; resolución alta; caro; sensible a las condiciones de la superficie
Diferencia clave en el estrés versus tensión
A continuación se muestra una tabla rápida que proporciona una visión general directa:
Aspecto
Estrés
Cepa
Fórmula
σ = f / a
ε = ΔL / L₀
Unidades
PA (N/m²), o PSI (LBF/in²)
Sin dimensión o %
Causa
Fuerza externa
Deformación causada por el estrés
Efecto
Genera fuerzas internas para contrarrestar las cargas externas; puede conducir a la deformación plástica, fractura, falla de fatiga o grietas por estrés por corrosión si es demasiado alto
Cambia la geometría del material; recuperable en límite elástico, permanente más allá del punto de rendimiento
Comportamiento
La fuerza interna por área que un material debe resistir. Dependiendo de la distribución, puede causar compresión, tensión, flexión o torsión
Describe cuánto se deforma el material bajo estrés aplicado; puede ser elástico o plástico
Cómo el estrés y la tensión se relacionan entre sí
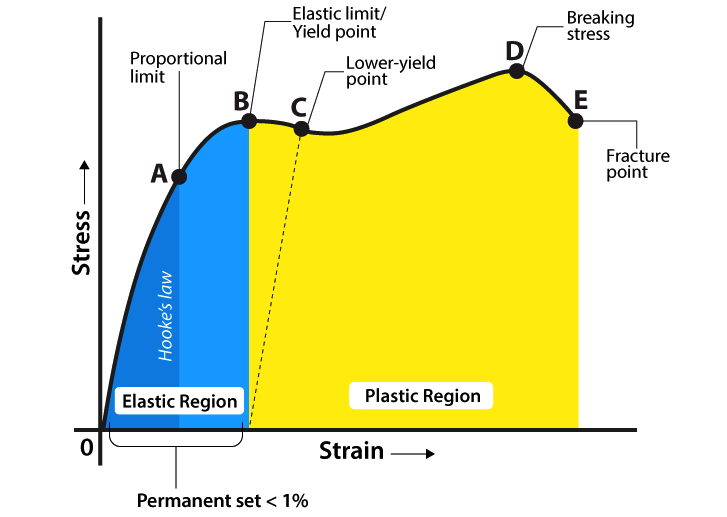
El estrés causa tensión. Una curva de tensión-deformación grica cómo un material se deforma bajo la carga aumentando gradualmente al trazar la tensión (deformación) contra el estrés aplicado. Revisemos sus puntos clave:
1. Región elástica (Punto O - B)
Región lineal (O-A):El estrés y la tensión son perfectamente proporcionales, siguiendo la ley de Hooke. Esta porción lineal termina en el límite proporcional, y su pendiente es el módulo de elasticidad (módulo de Young), lo que indica la rigidez del material. Dentro de este rango, la deformación es completamente elástica: una vez que se elimina la carga, el material vuelve a su forma original.
(Región no lineal A-B):El material aún se comporta elásticamente, es decir, la deformación es completamente recuperable, pero la relación se vuelve no lineal, lo que significa que la ley de Hooke ya no se aplica. Por lo tanto, el punto B se conoce como límite elástico: representa la fuerza máxima que el material puede soportar elásticamente, y la región OB se llama región elástica.
2. Región de plástico (punto B en adelante)
Cediendo (b-c):Después del punto B, el material entra en la región plástica y la deformación se vuelve permanente. El punto B también se conoce como punto de rendimiento superior, donde las dislocaciones se liberan repentinamente de sus obstáculos, por lo que la carga requerida cae brevemente incluso cuando el material continúa estirando. El estrés luego cae al punto C, el punto de rendimiento más bajo, en el que el nivel de estrés permanece casi constante, mientras que el material se alarga de una manera permanente (de plástico).
Tenga en cuenta que la meseta de rendimiento "superior → inferior" clara (B → C) es más obvia en los aceros bajos en carbono. Otras aleaciones a menudo se transmiten más suavemente a la deformación plástica sin una salsa de tensión pronunciada.
Endurecimiento por deformación (C - D):Después del punto C, el trabajo del material se endurece: a medida que las dislocaciones se acumulan e interactúan, aumenta la resistencia del metal a un mayor flujo. Aunque la sección continúa delgada y alargada, la resistencia creciente a la deformación impulsa el estrés de ingeniería más alto hasta que alcanza su máximo en el punto Dla máxima resistencia a la tracción(UTS). Esta es la carga más alta que la sección de calibre original puede sostener en las condiciones de prueba.
Cuanto a cuello y fractura (d - e):Más allá del punto D, comienza el cuello localizado, lo que provoca una reducción rápida en el área transversal en una región. En una curva de tensión-deformación de ingeniería, el estrés registrado luego cae a medida que disminuye la capacidad de carga del material. Finalmente, la región del cuello ya no puede sostener la carga, y las fracturas de muestras en el punto E. La cepa en E representa el alargamiento total del material por la falla.
¿Cuál es el módulo de Young?
Dentro de la región elástica entre O y A, la relación proporcional entre el estrés y la tensión se define por el módulo de Young, también conocido como el módulo de elasticidad o el módulo de tracción. Este valor cuantifica la rigidez de un material a través de la ley de Hooke:
E = estrés / tensión
Matemáticamente, eso es:
E = σ / ε
donde E es el módulo de Young con unidad PA o N/m2. Cuanto mayor sea el módulo, menos se deforma un material bajo un estrés dado.
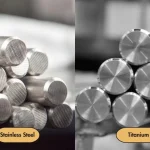
Ejemplos de estrés y tensión en diferentes materiales
Diferentes materiales responden de manera diferente bajo carga debido a su comportamiento único de tensión -deformación. A continuación hay algunos ejemplos que ilustran esto en la práctica:
Acero en marcos de construcción
En edificios de gran altura, las vigas y las columnas de acero estructurales llevan tensiones de compresión debido a cargas muertas y vivas (las tensiones de diseño a menudo se limitan a alrededor de 250 MPa). Con el módulo de un joven de 200 GPA, la tensión elástica correspondiente en el rendimiento es solo 0.125% (ε = σ/E). Más allá del punto de rendimiento, la tensión de acero leve y pueden mantener cepas plásticas de 10-20% antes de la fractura (resistencia a la tracción máxima 400-550 MPa). En la práctica, los ingenieros usan un factor de seguridad entre 1.5 y 2, manteniendo tensiones de trabajo por debajo de 150 MPa para evitar el pandeo o la deformación permanente.
Aluminio en estructuras de aviones
Las aleaciones de aluminio, como 2024-T3 y 7075-T6, experimentan tensiones alternativas de tracción y compresión de hasta 300 MPa durante el despegue, el aterrizaje y la turbulencia. Su módulo de 70 GPA produce cepas elásticas de 0.4-0.5%, aproximadamente tres veces más del acero al mismo estrés. Estas aleaciones ofrecen altas fortalezas finales de 500–600 MPa y alargamientos totales del 10-15%. La vida de la fatiga (entre los ciclos de 10⁶ y 10⁷) se gestiona al monitorear las amplitudes de tensión y las tasas de crecimiento de grietas para garantizar la durabilidad durante la vida útil.
Caucho en los neumáticos del coche
Los neumáticos del automóvil de goma sufren ciclos repetidos de tensión y compresión a medida que giran y se deforman contra la superficie de la carretera. Los compuestos de goma tienen resistencia a la tracción de 15–25 MPa y módulos elásticos bajos (1-10 MPa), pero exhiben cepas reversibles de 300–600% (algunas formulaciones de alto rendimiento superan el 1 000%). Esta gran deformación recuperable permite que el neumático se ajuste a las irregularidades de la carretera y absorba los choques. Los diseñadores también consideran la histéresis viscoelástica (pérdida de energía) y el crecimiento de la grieta de fatiga en millones de ciclos de carga para garantizar la durabilidad y la tracción a largo plazo.
Conclusión
Las curvas de tensión-deformación revelan propiedades mecánicas clave (módulo elástico, resistencia al rendimiento, resistencia a la tracción final, ductilidad y tenacidad) que guía la selección de material. Al analizar cómo el estrés distribuye e induce la tensión, los ingenieros predicen deformaciones y verifican que los componentes permanecen de manera segura en la región elástica, verificando los límites como el rendimiento o el pandeo.
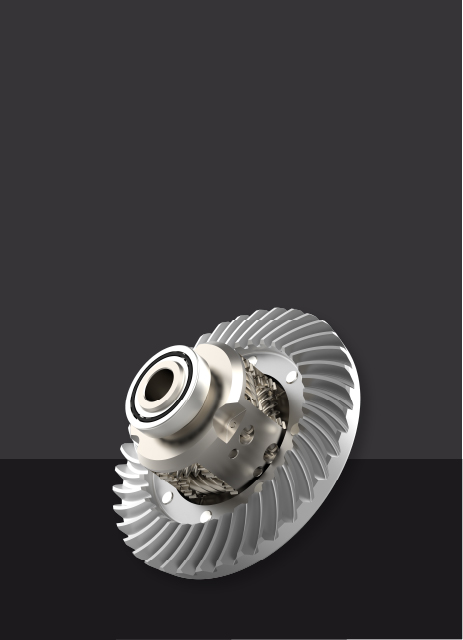
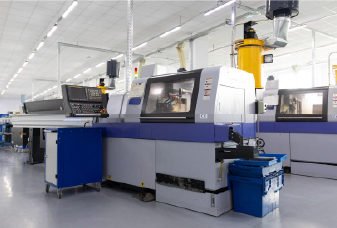
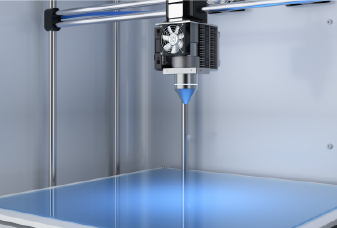
En Chiggo, combinamos experiencia en materiales profundos con avanzadoMecanizado CNCpara ayudar a dar vida a sus diseños. Nuestro equipo está listo para apoyar sus proyectos más difíciles como su socio de confianza: la calidad y la eficiencia que libera en cada paso del camino.Contáctenos hoy para obtener más información!
Preguntas frecuentes
1. ¿Cuál es la diferencia entre la tensión de ingeniería y la verdadera tensión?
La cepa de ingeniería se calcula simplemente como el cambio de longitud dividido por la longitud del calibre original, suponiendo que la longitud del medidor permanezca casi constante. La verdadera tensión, por el contrario, rastrea cada pequeño cambio de longitud en relación con la longitud continuamente cambiante de la muestra e integra estas cepas incrementales a lo largo del proceso de deformación. Para pequeñas deformaciones, los dos son casi iguales. Pero a medida que aumenta la deformación, la tensión de ingeniería subestima el cambio real, mientras que la cepa verdadera proporciona una medida exacta.
2. ¿Es la resiliencia la misma que la rigidez?
No. La rigidez, cuantificada por el módulo de Young, es la resistencia del material a la deformación elástica (la pendiente de la curva de tensión-deformación). La resiliencia es la energía recuperable por unidad de volumen que el material puede absorber en ese rango elástico (el área bajo la curva hasta el rendimiento).