エンジニアが「ストレス」について話すとき、それらは試験不安や仕事の圧力とは非常に異なるものを意味します。ここで、ストレスは材料内の単位面積あたりの内部力です。輪ゴムを伸ばすか、綱引きでロープを引っ張ると、緊張したストレスが動作しているのが見られます。
この記事では、引張応力が何であるか、圧縮応力や引張強度、重要な式、およびChiggoがこれらの考慮事項を現実世界の製造にどのように考慮するかとはどのように異なるかを説明します。
引張応力とは何ですか?
引張応力は、材料がそれを引き離そうとするときにどのように反応するかを説明します。それにより、材料が印加された荷重の軸に沿って伸びます。正式には、適用された力fを断面領域で割ったものとして定義され、その力に垂直です。
引張応力と圧縮応力
引張応力は、圧縮応力の反対です。力は、力がオブジェクトを伸ばすか延長するように作用するときに発生しますが、力はそれを絞ったり短くしたりするときに圧縮されます。固体の金属バーを想像してください:両端を引っ張ると、緊張したストレスが発生し、わずかに伸びます。まるでその長さに沿って押しつぶすようにするかのように、両端を押して、バーは圧縮されたストレス、短縮、または膨らみを経験します。
これらのストレスは、構造のさまざまな部分で同時に発生する可能性があります。たとえば、人や機械がコンクリートの床スラブを横切って移動すると、スラブの上面が圧縮に押し込まれ、底面が張力が伸びます。底部の引張応力が高すぎると、亀裂が現れる可能性があります。そのため、エンジニアは緊張に抵抗するために鉄の補強材を置きます。
引張応力と引張強度
引張応力 材料は、単位面積あたりの力として表される特定の瞬間に経験されている荷重です。適用された力に応じて上昇し、落ちます。抗張力 対照的に、固定された材料特性です。これは、材料が降伏または破損する前に処理できる最大引張応力です。
実際には、エンジニアは2つを常に比較しています。部分の実際の引張応力が引張強度を下回っている場合、部品はわずかに伸びますが、そのままのままです。ストレスが強度を超えると、障害が発生します。そのため、設計には常に安全マージンが含まれており、実世界のストレスが選択された材料の既知の強度をはるかに下回っていることを保証します。
引張応力式
引張応力は、材料が伸びるときに内部力を測定します。単純な式で計算されます。
σ= f / a
どこ:
σ=引張応力(Pascals、MPA、またはPSI)
f =適用力(ニュートンまたはポンド)
a =横断面積(mm²またはin²)
この方程式は、引っ張り力がどれほど集中しているかを教えてくれます。より高い負荷またはより小さな断面積は、より高い応力を生成します。たとえば、薄いワイヤに吊り下げられた同じ重量は、厚いケーブルよりもはるかに多くのストレスを生成します。これが、エンジニアがケーブル、ロッド、または梁のサイズをサイズして、使用されている材料の安全な制限をはるかに下回るストレスを維持する理由です。
しかし、この式はストレスの数値を与えてくれますが、材料自体がどのように反応するかは明らかにしません。突然スナップしたり、永久に曲げたり、元の形状に戻ったりしますか?それに答えるために、エンジニアはストレスとひずみ曲線に依存しています。
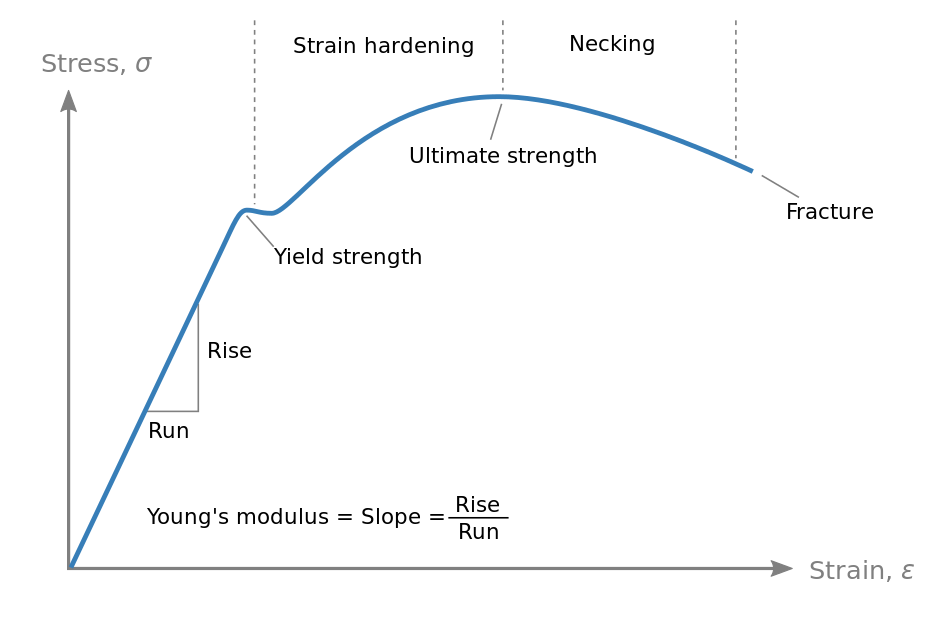
ストレス - ひずみ曲線を理解する
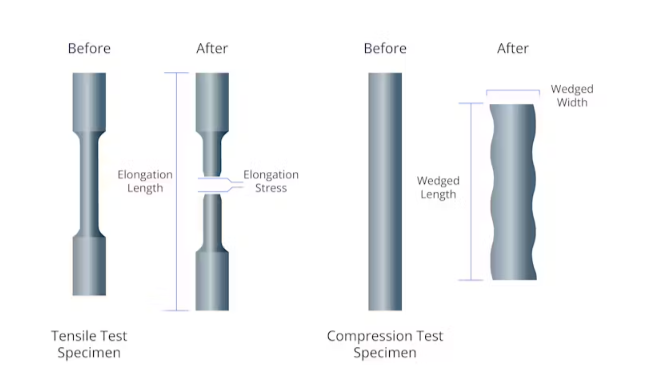
応力 - ひずみ曲線を作成するために、テスト標本(多くの場合、ドッグボーン型)を引張試験機に配置します。マシンは各端をつかみ、徐々にそれらを引き離し、サンプルが壊れるまで伸びます。このプロセス中、適用された応力と結果のひずみ(元の長さに対する長さの変化)の両方が連続的に測定されます。
結果は、X軸にひずみとY軸にストレスをかけてプロットされます。この曲線では、いくつかの重要なポイントを特定できます。
弾性領域
最初は、ストレスとひずみは比例します。これは、Hookeの法則が適用される弾性領域(σ=e≤ε)です。この線形セクションの勾配はです弾性率 (ヤングモジュラス)、剛性の尺度。この領域では、荷重が削除されると、材料は元の形状に戻ります。
降伏点
負荷が増加すると、曲線は直線から出発します。これは、弾性挙動が終了し、プラスチック(永久)変形が始まる降伏点です。この点を超えて、荷重が削除されていても、材料は元の形状を完全に回復することはありません。
究極の引張強度(UTS)
曲線はプラスチック領域に上方に続き、ピークに達します。この最高点は、究極の引張強度(UTS)です。これは、ネッキング(局所的な薄化)が始まる前に材料が耐えることができる最大応力を表します。
破壊点
UTSの後、曲線は標本の首が下に傾斜し、それほど多くの負荷を運ぶことができなくなります。最終的に、材料は破壊点で壊れます。延性材料の場合、骨折のストレスは通常、ネッキングのためにUTよりも低くなります。脆性材料の場合、骨折は弾性限界近くで突然発生する可能性があり、プラスチックの変形はほとんどまたはまったくありません。
引張応力の実際のアプリケーション
材料が引っ張られたり、ハングしたり、伸びたりする状況では、引張応力が負荷を安全に運ぶことができるか、失敗するかを決定します。いくつかの重要なアプリケーションと例を次に示します。
橋と建設
ゴールデンゲートブリッジのようなサスペンションブリッジを考えてください。塔の間に覆われた巨大なスチールケーブルは、一定の引張応力下にあり、道路と車両の重量を支えています。エンジニアは、これらのケーブルの高張力強度鋼を選択して、重い荷重に加えて風や地震などの余分な力を失敗させることなく処理できます。また、現代の建設は緊張を巧みに利用しています。たとえば、プリストレスのあるコンクリートでは、鋼腱が埋め込まれて伸びているため、ビームが荷重を安全に処理できるようにします。
ケーブル、ロープ、チェーン
多くの日常のシステムは、引張ストレスに直接依存しています。たとえば、エレベーターを取り上げます。そのスチールケーブルは一定の張力であり、車の重量だけでなく、加速または停止するときに余分な力を運びます。クレーンは同じ原則に基づいて動作し、高張力ケーブルを使用して重い荷重を安全に持ち上げて移動させます。ギターのような単純なものでさえ、引張ストレスが機能しています。チューニングペグをよりタイトにするほど、ひもの張力が大きくなります。
機械とボルト
機械工学では、引張応力も同様に重要です。飛行機または車のエンジンのボルトとネジは、わずかに伸びています。結果として生じる引張応力は、部品を保持するクランプ力を作成します。ボルトが過度にストレスをしている場合(締めたときにトルクが大きすぎる、または使用中の過剰な負荷)、それは降伏して失敗する可能性があり、潜在的にマシンがバラバラになります。そのため、ボルトは収量と引張強度を示すグレードによって評価され、重要なボルトが指定された緊張に引き締まる理由です。
引張ストレスをチグゴの製造サービスに統合します
引張ストレスの理論を知ることは1つのことですが、実際の負荷の下で実行される部品の設計も別です。チグゴでは、そのギャップを埋めます。
私たちのチームは、CNCの機械加工、射出成形、シートメタル、3D印刷であなたをサポートし、すべての段階に強度の考慮事項が統合されています。プロトタイプを開発するか、生産に合わせてスケーリングするかにかかわらず、適切な素材とプロセスを選択して、パフォーマンスの要件を満たし、費用のかかる障害を回避します。
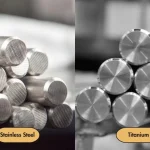
材料の選択
障害に対する最初の保護手段は、適切な材料を選択することです。 Chiggoでは、リストされているすべての合金とポリマーには、サプライヤーデータに裏打ちされた引張と降伏強度などの検証済みの機械的特性があり、必要に応じて認定をテストします。
これは、エンジニアがコストや終了だけでなく、負荷の下で実証済みの強度でオプションを比較できることを意味します。たとえば、アルミニウム6061-T6と7075-T6を決定する場合、特にブラケット、ハウジング、またはその他の荷重含有コンポーネントの場合、引張強度は重要なフィルターになります。
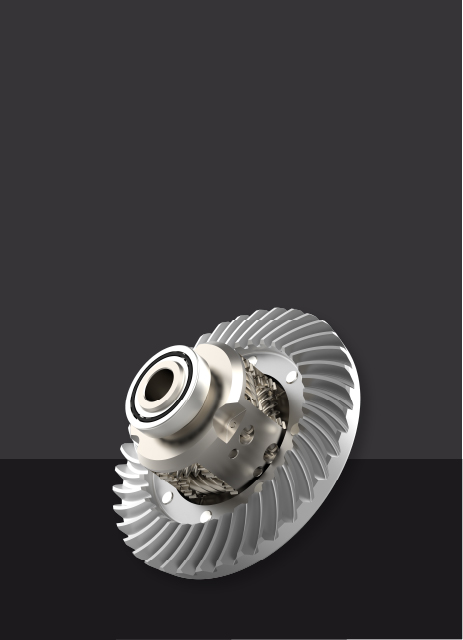
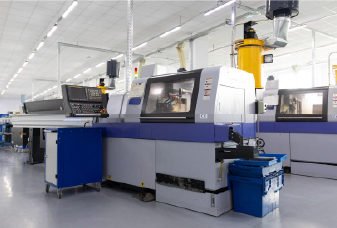
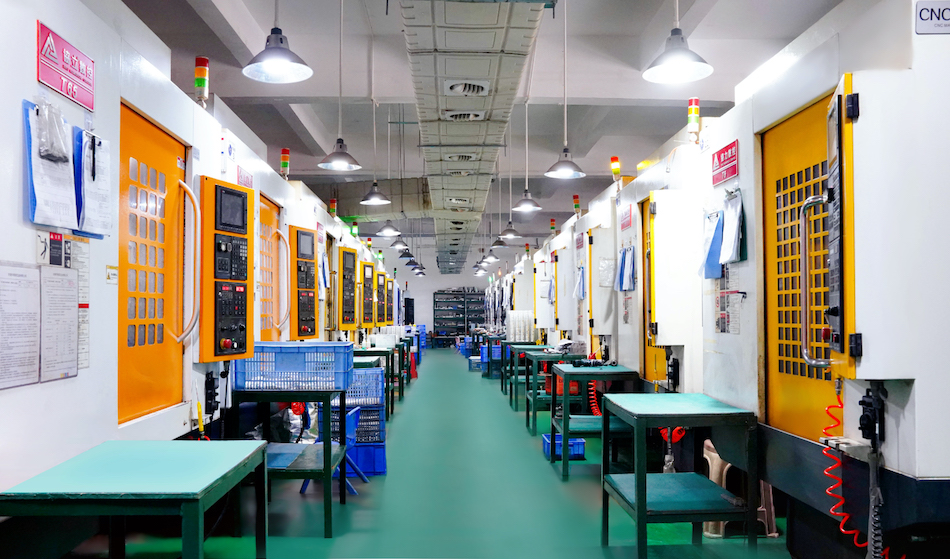
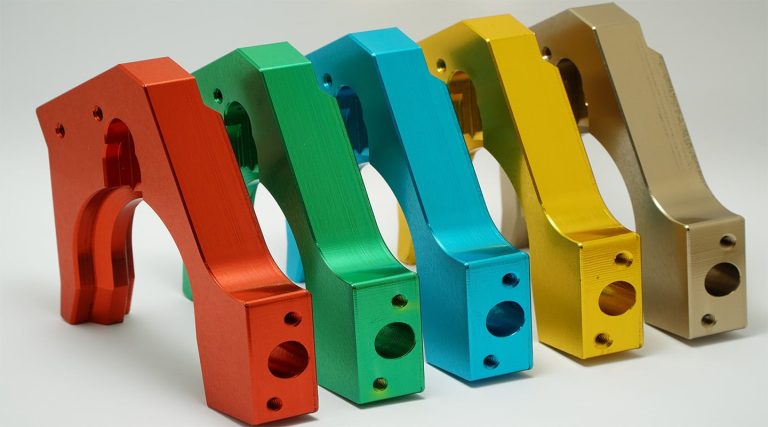
CNC加工
でCNC加工 、材料は等方性強度を保持するため、通常はパフォーマンスが予測可能です。本当のリスクは、デザインの詳細からもたらされます。鋭い角、薄い壁、または突然のジオメトリの変化はすべて、ストレス濃縮器として機能する可能性があります。
私たちのエンジニアは、これらの問題を早期に特定し、フィレットを拡大したり、壁の厚さを調整したり、より丈夫な合金に切り替えたりする実用的なソリューションを推奨します。これらの改良は、完成した部品が完全な引張機能を保持することを保証します。
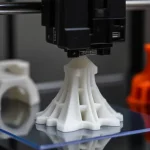
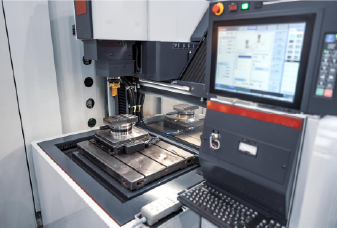
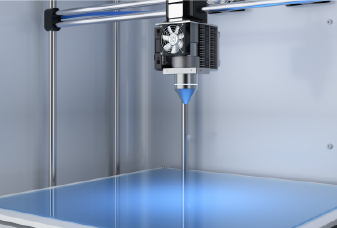
3D印刷
3Dプリントパーツは、その強度が印刷方向に依存するため、異なる動作を異なります。たとえば、FDMでは、Z軸に沿った結合が弱くなります。つまり、負荷が垂直に適用されると、部分がより簡単に故障する可能性があります。
材料の選択とプロセス設定も大きな役割を果たします。 PLAやABSなどの標準的なプラスチックはプロトタイプに適していますが、エンジニアリンググレードのナイロンまたはカーボンファイバー強化ポリマーは、機能部品に対してはるかに高い耐性を提供します。インフィル、層の厚さ、および構築方向は、部品の負荷の下でのパフォーマンスにさらに影響します。
金属の場合、添加剤の製造中の迅速な加熱と冷却は、部品をゆがんだり亀裂することができる残留応力を生み出します。私たちのエンジニアは、弱い方向とストレスに敏感な機能に早期にフラグを立てます。部品の再配向、充填の増加、またはより強力な材料の選択をお勧めします。必要に応じて、アニーリングなどの建物後の治療は、ストレスを和らげ、安定性を改善するのに役立ちます。
射出成形
射出成形では、引張強度は、ポリマー自体だけでなく、金型の流れや冷却方法にも依存します。充填中、分子鎖はしばしばフローパスに沿って整列し、一方の方向では部分が強くなりますが、別の方向では弱くなります。不均一な冷却は、内部応力を閉じ込める可能性があり、反り、シンクマーク、または負荷の下で亀裂につながります。
ここでもデザインの詳細が重要です。薄い壁、貧弱なゲートの配置、または溶接ラインはすべてストレスポイントに変わる可能性があります。フローパス、壁の厚さ、および冷却バランスを設計の初期に確認することにより、私たちのチームはこれらのリスクを減らし、成形部品を強く安定させるのに役立ちます。
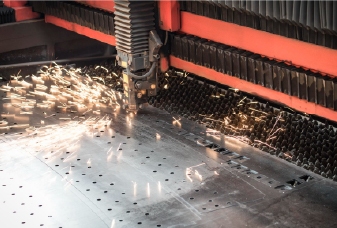
鋳造
鋳造では、冷却と固化中に引張問題がしばしば発生します。セクションがさまざまな速度で冷却されるため、内部ストレスが蓄積し、熱い涙、収縮亀裂、または歪みを引き起こす可能性があります。
カビのデザインが大きな役割を果たします。厚いから薄い遷移、鋭い角、またはリザーズの不十分なライザーはすべて、ストレスを集中させ、パフォーマンスを弱めることができます。安定した凝固挙動と冷却速度を制御する合金を選択すると、これらのリスクを減らすことができます。
チグゴで , our engineers review designs before tooling begins to spot high-risk features early. We may recommend smoother transitions, adjusted wall thicknesses, or changes to gating and riser systems to balance solidification. Where needed, we also suggest post-casting treatments such as annealing to relieve built-in stresses.