From skyscraper girders to jetliner wings, every engineered structure relies on material stiffness to perform safely and efficiently. Young’s modulus—the ratio of stress to strain in the elastic region, is the universal measure of that stiffness. By understanding Young’s Modulus, designers can predict exactly how much beams will bend or shafts will spring under load, ensuring safety without overbuilding.This article presents Young’s modulus—what it is, how it’s calculated, a comparison of E values for common materials, industrial applications, and more.
What Is Young's Modulus?
Young’s modulus, often called the elastic modulus or tensile modulus and denoted by E (or Y), quantifies a material’s resistance to elastic deformation under tensile or compressive loads (stiffness). Mathematically, it is defined as the ratio of stress (force per unit area) to strain (relative change in length) within the linear elastic region of the stress–strain curve. Unlike “elasticity,” which simply denotes a material’s ability to spring back to its original shape, the elastic modulus provides a precise numerical measure of how hard it is to deform that material. Young’s modulus is one of the three fundamental elastic constants, along with shear modulus and bulk modulus, that together characterize the full elastic response of isotropic solids.
Stress–Strain Curve and Elastic Range: A Quick Refresher
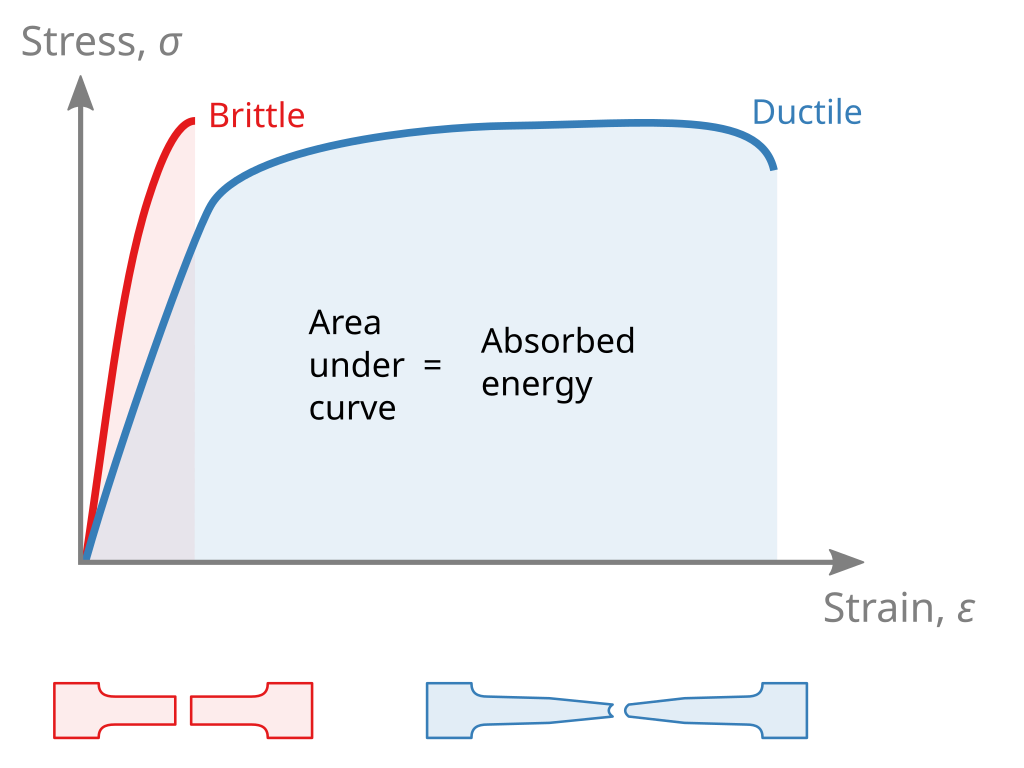
In a tensile test, stress (in pascals, Pa, or megapascals, MPa) is plotted on the vertical axis against strain (unitless) on the horizontal axis to produce a stress–strain curve.The straight-line segment up to the proportional limit defines the linear elastic region, where Hooke’s law holds and Young’s modulus (E) is simply the slope of that line. A steeper slope means a stiffer material.
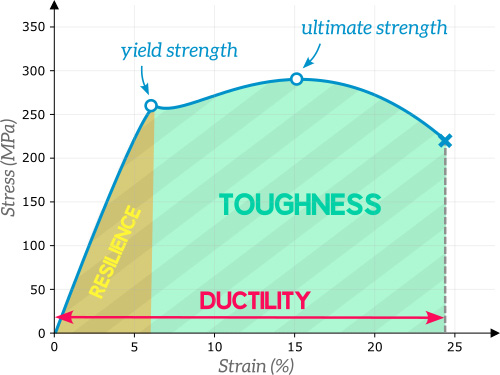
Brittle materials (red curve) fracture at very low strains and absorb little energy, while ductile materials (blue curve) endure much larger strains and absorb more energy before failure. Beyond the proportional limit—around the yield point—plastic (permanent) deformation begins, the stress–strain relationship ceases to be linear, and the material will not fully spring back to its original shape. The total area under the entire curve represents toughness, the energy a material can absorb before it fractures.
Young’s Modulus Formula and Unit
Young’s modulus E is defined as the ratio of stress to strain in the linear elastic region. Since strain is dimensionless, E carries the same unit as stress: pascals (Pa = N/m²) in SI or pounds per square inch (psi = lbf/in²) in imperial units. One psi is approximately 6,894.8 Pa. Below are the standard equations for calculating E and the units you’ll use in practice.
1. Basic definition
σ (stress): Internal force divided by the loaded cross sectional area (units: N/m², Pa, or lbf/in²). ε (strain): Relative deformation—the change in length divided by the original length (dimensionless).
2. Tensile‐test form
F: applied tensile force (N or lbf) A: original cross-sectional area (m² or in²) ΔL: change in length (m or in) L₀: original gauge length (m or in)
Young's Modulus Example
A high Young’s modulus indicates a stiff material that resists elastic deformation under load and does not stretch easily. A low modulus means the material deforms significantly even under small loads, stretching with little force. Natural rubbers, for example, have very low E values—some silicone rubbers can even stretch under their own weight. Below is a table of common materials and their reference Young’s modulus values:
Material
Young’s Modulus (GPa)
Young’s Modulus (Mpsi)
Carbon Steel (low/medium)
200–210
29.0–30.5
High-Strength Low-Alloy Steel (HSLA)
200–210
29.0–30.5
Tool Steel (quenched & tempered)
205–215
29.7–31.2
Austenitic Stainless Steel (304/316)
190–200
27.6–29.0
Ferritic / Martensitic Stainless (410/430)
195–210
28.3–30.5
Cast Iron (gray)
110–170
16–25
Ductile Iron (nodular)
160–175
23.2–25.4
Aluminum (wrought alloys)
69–71
10.0–10.3
Cast Aluminum (Al-Si)
68–72
9.9–10.4
Magnesium (AZ / AM alloys)
43–45
6.24–6.53
Cast Magnesium
40–45
5.8–6.5
Copper
115–125
16.7–18.1
Brass (Cu–Zn)
97–115
14.1–16.7
Bronze (Cu–Sn)
100–120
14.5–17.4
Nickel (commercially pure)
200–210
29.0–30.5
CP Titanium (Grade 2)
100–110
14.5–16.0
Ti‑6Al‑4V
110–120
16.0–17.4
Zinc (cast/rolled)
83–108
12.0–15.7
Tin
40–55
5.8–8.0
Lead
14–17
2.0–2.5
Concrete (normal weight)
20–35
2.9–5.1
High-Strength Concrete
30–45
4.35–6.53
Epoxy Resin (unfilled)
2.5–3.5
0.36–0.51
Epoxy / Glass Laminate (FR4, in-plane)
17–24
2.5–3.5
GFRP Laminate (quasi-isotropic)
18–28
2.61–4.06
GFRP UD (fiber direction)
35–50
5.08–7.25
CFRP Laminate (quasi-isotropic)
50–80
7.25–11.6
CFRP UD (fiber direction)
130–200
18.9–29.0
Wood (Softwood e.g. Pine, along grain)
8–12
1.16–1.74
Wood (Hardwood e.g. Oak, along grain)
10–14
1.45–2.03
Soda‑Lime Glass
68–72
9.9–10.4
Borosilicate Glass
63–67
9.1–9.7
Fused Silica
72–75
10.4–10.9
Alumina (95–99%)
300–380
43.5–55.1
Zirconia (Y‑TZP)
190–210
27.6–30.5
ABS (unfilled)
2.0–2.4
0.29–0.35
Polycarbonate (PC)
2.2–2.45
0.32–0.36
PMMA (Acrylic)
2.4–3.2
0.35–0.46
HDPE
0.6–1.0
0.087–0.145
LDPE
0.10–0.40
0.015–0.058
LLDPE
0.20–0.45
0.029–0.065
Polypropylene (PP homopolymer)
1.3–1.7
0.19–0.25
PP Copolymer (impact)
1.1–1.5
0.16–0.22
PP GF (20–40%)
3.0–8.5
0.44–1.23
PET (unfilled)
2.7–3.2
0.39–0.46
PBT (unfilled)
2.2–2.8
0.32–0.41
POM (Acetal)
2.9–3.2
0.42–0.46
Nylon 6 (dry)
2.5–3.0
0.36–0.44
Nylon 66 (dry)
2.7–3.3
0.39–0.48
PA12 (unfilled)
1.4–1.8
0.20–0.26
Nylon 6 30% GF (dry)
7.5–8.5
1.09–1.23
Nylon 66 30% GF (dry)
7.5–9.0
1.09–1.31
PBT 30% GF
8.0–9.5
1.16–1.38
PET 30% GF
9.0–12.0
1.31–1.74
POM 25–30% GF
6.5–8.5
0.94–1.23
PEEK (unfilled)
3.6–4.0
0.52–0.58
PEEK 30% GF
10–12
1.45–1.74
PEI (unfilled)
3.0–3.3
0.44–0.48
PPS (unfilled)
3.2–3.8
0.46–0.55
PPS 30% GF
8–9
1.16–1.31
PPS 40% GF
9–11
1.31–1.60
Rigid PVC
2.4–3.3
0.35–0.48
PTFE
0.40–0.55
0.058–0.080
PLA
3.0–3.6
0.44–0.52
Rubber (natural, small strain)
0.01–0.05
0.0015–0.007
Neoprene Rubber (small strain)
0.005–0.02
0.0007–0.0029
Polyurethane Foam (rigid)
0.02–0.30
0.0029–0.043
Polyurethane (solid elastomer)
0.01–0.05
0.0015–0.007
Epoxy Structural Adhesive (cured)
1.8–2.6
0.26–0.38
Diamond (single crystal)
1050–1200
152–174
The table shows reference values measured at room temperature under standard conditions, E can vary in real-world use. As temperature rises, E generally decreases, making materials softer. Microstructure and composition—including alloying elements, grain size, heat-treatment history, or the degree of crystallinity in polymers—also affect stiffness. Many materials are anisotropic, with different E values along different directions (for example, wood, rolled metals, and fiber composites). Finally, strain rate and environment play a role: very high loading rates or exposure to corrosive fluids can subtly change the measured modulus.
Young’s Modulus Applications
Young’s modulus is the go-to property whenever engineers need to predict or limit elastic deflection and vibration. Below are some key applications:
Beam and Girder Design
When engineers design a bridge beam or girder, one of the first questions is “How much will it bend under load?” That bend is called deflection, and the maximum downward movement at the midpoint of a simply supported span is denoted by δ. In everyday terms, δ tells you how far the bridge deck will sag when cars, wind, or even an earthquake push on it. The standard formula for a single, center-loaded span is:
where F is the load at mid-span (e.g., the weight of vehicles), L is the length of the span, E is Young’s modulus (the material’s stiffness), and I is the cross-section’s moment of inertia (its shape-dependent resistance to bending). A higher Young’s modulus directly reduces δ, meaning the beam sags less. Controlling δ is critical: too much deflection not only looks unsafe but can also damage road surfaces, joints, and supports. Engineers use this calculation to choose materials and beam sizes that keep deflections within strict service-limit guidelines (for example, no more than L/360 of the span) so bridges stay both safe and comfortable to use.
Concrete and Composite Slabs
In a typical concrete floor or roof slab, engineers embed steel bars (rebar) inside the concrete. Concrete by itself is fairly soft—it bends more under load—while steel is very stiff and hardly bends at all. By combining them, the slab carries heavy loads without sagging or cracking: the concrete takes the compression, and the steel handles the tension and adds rigidity.
To predict exactly how much the slab will bend, engineers use each material’s Young’s modulus (about 17 GPa for concrete and 200 GPa for steel). They “translate” the steel’s stiffness into an equivalent amount of concrete thickness, so the whole slab can be treated as one material in calculations. This lets them ensure that, under normal live loads (people, furniture, snow), the beam will only deflect by a tiny amount—usually no more than 1/360th of its span—keeping floors crack-free, comfortable to walk on, and safe.
Aerospace and Aviation
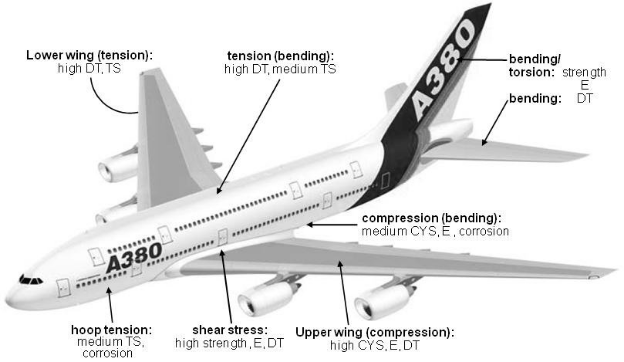
Airplane wings and fuselage panels must be extremely stiff so they don’t bend too much in flight. Engineers plug a material’s stiffness (Young’s modulus, E—in the range of 70 GPa for aluminum, 105 GPa for titanium, or up to 150 GPa for carbon‐fiber composites) into computer simulations to see exactly how much a wing will flex under lift. This lets them choose the right thickness and internal supports so the plane stays both strong and light.
The same stiffness requirements apply even more strictly in rockets and satellites, where every gram counts. By using materials with very high E (over 100 GPa for advanced composites), designers can predict and avoid vibrations that might shake equipment apart during launch or orbit. In simple terms, knowing E tells them how “springy” each part will be and helps ensure nothing resonates dangerously in space.
Consumer Goods and Sports Equipment
Carbon-fiber composites are prized in sporting goods because they combine very high stiffness (Young’s modulus up to ~120 GPa along the fibers) with exceptionally low weight. By orienting the carbon fibers in specific “layups,” manufacturers tune each item’s flex—so a ski pole resists bending under load, a bicycle frame feels stiff under pedaling yet absorbs road vibrations, and a golf club delivers power without whipping too much.
Electronics housings and smartphone frames face a different challenge: they must stay rigid enough to protect delicate components when gripped or dropped, yet flex slightly to avoid cracking. Engineers use Young’s modulus to predict how much a thin metal or polymer shell will bend under everyday forces, ensuring that minor elastic deformation won’t damage screens or internal circuitry.
Quality Control and Material Testing
Manufacturers routinely check Young’s modulus to make sure materials meet their specifications. In batch verification, samples of steel bars, plastic pellets, or composite sheets are pulled in a tensile test to measure how stiff they are. If the stiffness (E) falls more than about 5 % below the expected value, it can indicate problems in the alloy mix, plastic curing process, or contamination—so the whole batch may be rejected before parts are made.
For non-destructive evaluation, companies use ultrasound instead of cutting out samples. A sensor sends sound waves through a pipe, rail, or forging and measures the wave speed v. Since Young’s modulus relates to density ρ and wave speed by
Engineers can calculate stiffness on the spot. This quick, in-line check catches defects early, saving time and avoiding costly failures down the line.
Computer-Aided Engineering and Simulation
Modern engineering relies on computer models to see how a part or structure will behave before it’s ever built. In finite‐element analysis, the software breaks a design into thousands of tiny pieces and uses each material’s stiffness (Young’s modulus, E) to predict how those pieces bend, stretch, or vibrate under real‐world loads. Accurate E values mean the model will show realistic sagging, stress “hot spots,” and natural vibration frequencies—helping engineers catch problems early and design safer products.
Beyond checking strength, designers also use topology optimization to shape parts for maximum stiffness at minimum weight. The computer starts with a block of material and, using E as a guide, removes anything that isn’t needed to carry the load. The result is often a lightweight, organic‐looking structure that delivers the highest possible performance without excess material.
Does an Object’s Shape Affect Its Young’s Modulus?
In practice, Young’s modulus is an intrinsic material property—it never changes if you cut, bend, or reshape the metal, plastic, or composite. For example, an I-beam made from the same steel as a solid bar won’t have a higher E value, but its “I” shape dramatically increases bending resistance because more material sits farther from the neutral axis (the line within the cross-section that experiences zero stress during bending). That geometric effect comes from the beam’s moment of inertia, not a change in Young’s modulus. When engineers size beams, plates, or tubes, they combine the material’s E (to know how stiff each square millimeter is) with the section’s moment of inertia (to know how that stiffness is distributed). Together, these factors let them design structures that carry heavy loads without excessive sagging or bending.
What Is the Relationship Between Young’s Modulus, Shear Modulus, and Bulk Modulus?
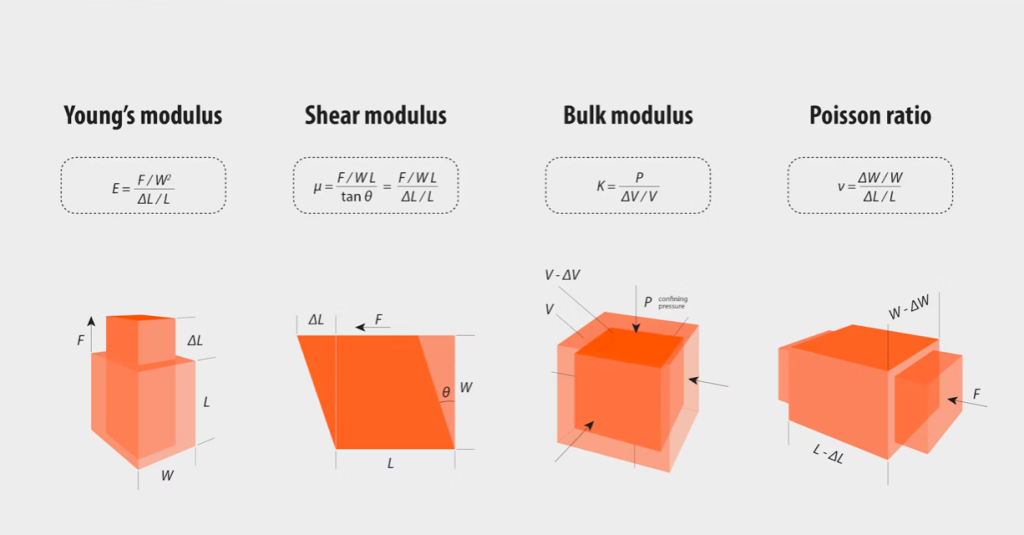
Just as Young’s modulus (E) measures a material’s stiffness under tension or compression, the shear modulus (G) gauges its resistance to shape-changing (shear) deformations—imagine twisting a metal rod: the torque you apply produces an angular twist that G characterizes. Meanwhile, the bulk modulus (K) quantifies how a material resists uniform compression, like squeezing a rubber ball in all directions and measuring its volume change. All three describe elastic behavior, but in different “modes” of loading: axial (E), torsional or shear (G), and volumetric (K).
Because isotropic materials respond predictably in all directions, these three moduli are linked through Poisson’s ratio (ν)—the factor that tells how much a material “bulges” sideways when stretched. Once you know any two of E, G, K, or ν, you can calculate the others, ensuring your models capture tension, shear, and compression consistently:
What Is Stiffness vs Strength vs Toughness?
Stiffness is how little a material deforms elastically under load. A very stiff material (high E) barely bends under service loads. However, stiffness alone doesn’t tell you whether that material can carry high loads without breaking, nor how much energy it can absorb before failure.
Strength describes the maximum stress a material can withstand before permanent deformation (yield strength) or fracture (ultimate tensile strength, UTS). A strong material resists high loads, but it may still deform noticeably (if it’s not very stiff) or crack suddenly (if it’s not very tough).
Toughness combines strength and ductility—it’s the total energy per volume a material absorbs before fracturing (the area under the stress–strain curve). A tough material can undergo both high stress and large deformation, absorbing impact without failing catastrophically. Yet even a very tough material might be relatively flexible (low stiffness) or unable to support very large loads if its strength is moderate.
Property
What It Measures
How It’s Quantified
Typical Units
Relationship to Others
Stiffness
Resistance to elastic deformation
Youngs modulus, E
GPa (N/m²)
High stiffness ≠ high strength or toughness—controls deflection only
Strength
Maximum stress before yielding or fracture
Yield strength; Ultimate Tensile Strength (UTS)
MPa (N/m²)
High strength ≠ high stiffness or toughness—controls load capacity
Toughness
Energy absorbed before fracture
Area under stress–strain curve; impact tests
J/m³
High toughness requires both strength and ductility—controls energy absorption
Conclusion
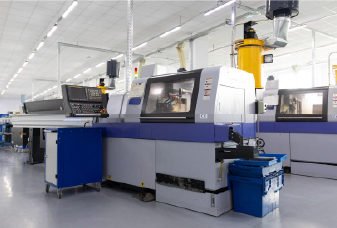
Understanding Young’s modulus is essential for selecting the right materials, predicting structural behavior, and optimizing designs across industries. Whether you’re prototyping with rapid 3D printing or scaling up to full production, precise knowledge of material stiffness ensures performance, safety, and cost-efficiency. Chiggo provides a wide range of manufacturing capabilities, including 3D printing ,CNC Machining and other value-added services, for all your prototyping and production needs. Visit our website to learn more or to request a free quote.