قوة الشد النهائية (UTS) هي مقياس لأقصى إجهاد يمكن للمادة تحمله قبل الانهيار. عادة ما يتم العثور على UTS من خلال إجراء اختبار الشد وتسجيل الإجهاد الهندسي مقابل منحنى الإجهاد. كماملكية مكثفة، UTS ضروري لمقارنة أداء المواد تحت التوتر. يساعد المهندسين على اختيار المواد المناسبة للهياكل والمكونات التي يجب أن تقاوم أحمال الشد دون فشل.
سوف تستكشف هذه المقالة ما هي قوة الشد النهائية ، وكيف يتم اختبارها وحسابها ، وكذلك تطبيقاتها.
ما هي قوة الشد النهائية؟
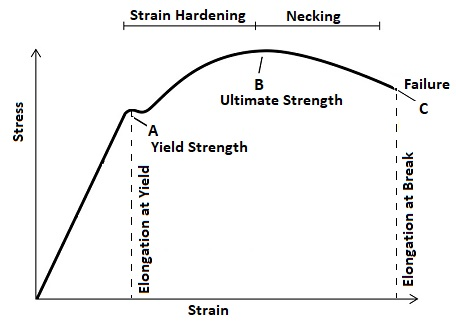
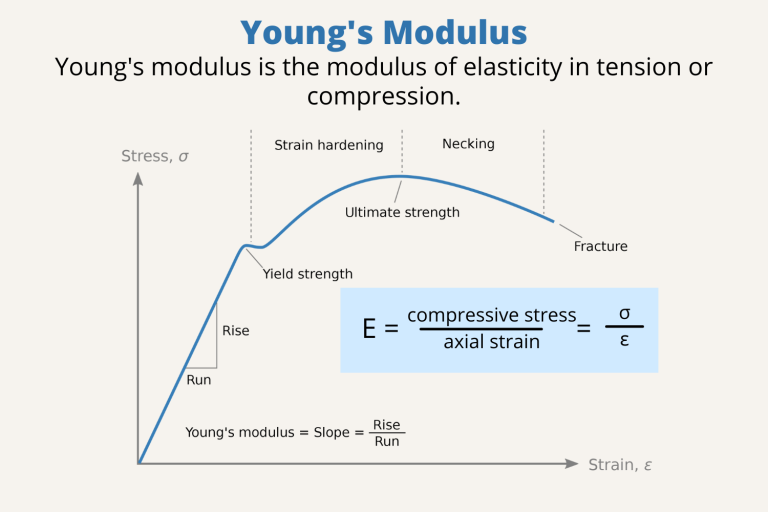
قوة الشد النهائية (UTS) ، والمعروفة أيضًا باسم قوة الشد أو القوة النهائية ، هي الحد الأقصى لمقدار الشد (سحب أو تمديد) الإجهاد الذي يمكن للمادة تحمله قبل الانهيار. أثناء اختبار الشد ، تخضع المادة في البداية إلى تشوه مرن ؛ بمجرد أن تتجاوز نقطة العائد ، تستمر في تشوه بلفيقة حتى تصل إلى الحد الأقصى من الإجهاد. يمثل UTS ذروة الضغط على منحنى الإجهاد الهندسي ، مما يعكس أكبر مقاومة للمادة للانفصال.
كما هو موضح في الرسم البياني ، النقطة ب هي قوة الشد النهائية. بعد هذه النقطة ، في مواد الدكتايل ، تمر العينة بالتراجع ، مما يؤدي إلى انخفاض في الضغط الذي يمكن أن يحافظ عليه حتى الكسر ، في حين أن المواد الهشة قد تنكسر فورًا تقريبًا بعد الوصول إلى UTS دون أن يتناقص بشكل كبير.
يعد UTS مقياسًا رئيسيًا في اختيار المواد لتطبيقات الحمل ويساعد المهندسين على ضمان عدم تفشل المكونات بشكل كارثي تحت أقصى أحمال متوقعة. ومع ذلك ، نظرًا لأن UTS وحدها لا تلتقط مقدار التشوه الدائم الذي يمكن أن يتحمله المادة ، فيجب تقييمها مع الخصائص الميكانيكية الأخرى مثل قوة العائد ، وصياغة الكسر ، والاستطالة لفهم سلوك المادة بشكل كامل في ظل ظروف الخدمة الواقعية.
كيف يتم اختبار قوة الشد؟
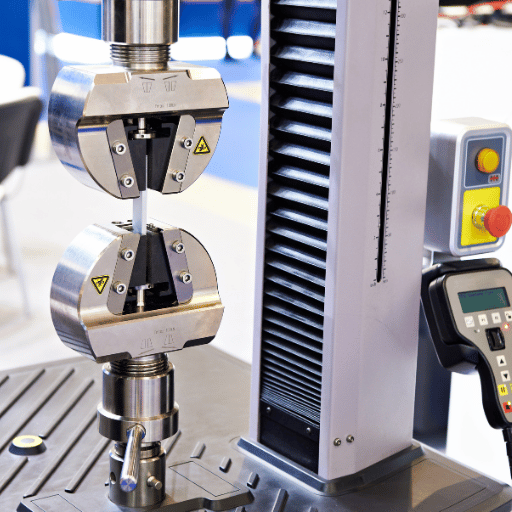
يتم تعريف قوة الشد على أنها إجهاد ، يتم قياسه كقوة لكل وحدة مساحة. يمكنك تقييم قوة الشد للمواد باستخدام آلة اختبار الشد ، والمعروفة باسم آلة الاختبار العالمية (UTM). لديها اثنين من قبضة التي تحمل العينة في كلا الطرفين.
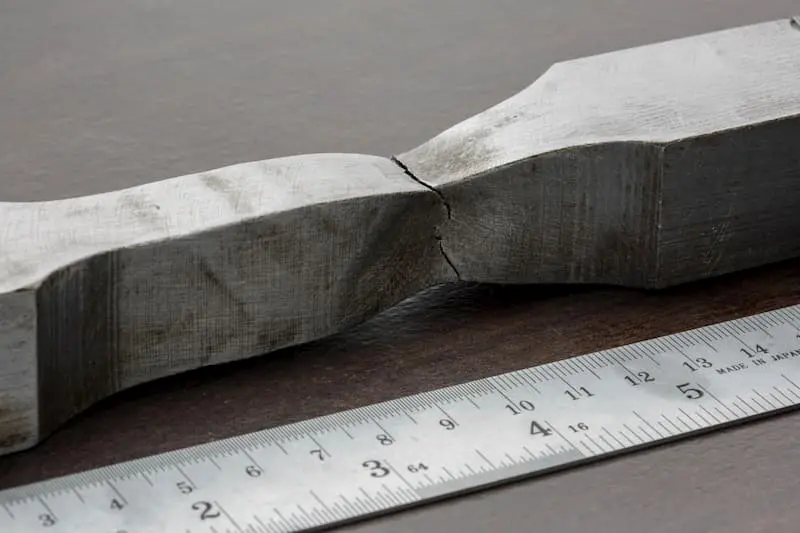
أثناء الاختبار ، يطبق هذا الجهاز حمولة شد متزايدة بشكل مطرد حتى كسور المواد. خلال العملية ، يسجل باستمرار القوة المطبقة والاستطالة المقابلة للعينة. تنتج بيانات الاختبار منحنى الإجهاد الإجهاد ، والتي يتم تحديدها من أقصى قيمة للإجهاد-قوة الشد النهائية (UTS)-.
توفر نتائج اختبار الشد هذا البيانات الرئيسية اللازمة لحساب قوة الشد. يستخدم هذا الحساب أقصى قوة مسجلة ومنطقة العينة المستعرضة الأصلية لقياس UTS بدقة.
كيف يتم حساب قوة الشد؟
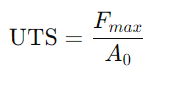
يتم حساب قوة الشد من خلال تقسيم أقصى قوة الشد التي يمكن أن تتحملها المادة قبل الانهيار من منطقة المستعرضة الأصلية. الصيغة لحساب قوة الشد النهائية هي:
القوة (أو الإجهاد) = القوة / المنطقة
من الناحية الرياضية ، يمكن التعبير عن ذلك على النحو التالي:
عندما يكون FMAX هو الحد الأقصى المحمل المسجل أثناء اختبار الشد ، و A0 هو المساحة المقطعية الأولية للعينة. يعطي هذا الحساب قوة الشد النهائية في وحدات الإجهاد ، وعادة ما يكون pascals (PA) ، megapascals (MPA) أو الجنيهات لكل بوصة مربعة (PSI). من خلال ربط الحمل الذروة بالمنطقة الأصلية للعينة ، يمكن للمهندسين مقارنة المواد المختلفة باستمرار ، بغض النظر عن حجمها أو شكلها.
ما هي العوامل التي قد تؤثر على قوة الشد النهائية للمادة؟
على الرغم من أن UTS تصف خاصية أساسية لمقاومة المادة لإجهاد الشد ، فإنها ليست قيمة ثابتة أو غير قابلة للتغيير. يمكن أن تختلف UTS على نطاق واسع بسبب العديد من المواد والمعالجة. قد تؤثر الجوانب الرئيسية التالية على UTS للمادة:
التكوين الكيميائي
تؤثر عناصر صناعة السبائك أو الإضافات في المادة بشكل مباشر على الترابط الذري ، وهيكل الطور ، والقوة الكلية. على سبيل المثال ، فإن إضافة الكربون إلى الحديد ينتج عن بيرليت أو martensite (مع رواسب Fe₃C) ، والتي تعيق حركة الخلع وترفع UTs أعلى بكثير من الحديد النقي. يستقر النيكل في الفولاذ المقاوم للصدأ الأوستنيتي على مرحلة FCC ، والتي تعمل بشكل جيد على العمل بشكل جيد ويزيد من قوة الشد.
حجم الحبوب (البنية المجهرية)
الحبوب الدقيقة تؤدي عمومًا إلى ارتفاع UTS. العلاجات الحرارية التي تقوم بتحسين (تقلص) هيكل الحبوب تنتج المزيد من حدود الحبوب ، والتي تمنع حركة الخلع وتجعل المعدن أكثر صعوبة في التشويه. هذا هو المعروف باسم تأثير القاعة. وعلى العكس من ذلك ، فإن الحبوب الخشنة (من التبريد البطيء أو ارتفاع درجة الحرارة) تعطي قوة أقل.
المعالجة الحرارية
يغير المعالجة الحرارية البنية المجهرية للمادة ، وبالتالي يمكن أن تغير UTS بشكل كبير. بالنسبة إلى الفولاذ ، يبرد تبريد أوستنيت إلى martensite الصلب ، وزيادة UTS بشكل حاد ، في حين أن التخفيف اللاحق يخفف من الضغوط الداخلية ويعيد ليونة ، مما ينتج عنه أداء ميكانيكي أكثر توازناً. في المقابل ، يحول الصلب ببطء الأوستينيت إلى بيرليت خشن والفريت ، وتنعيم الصلب ، ويعزز ليونة وقابلية الآلات ، وعادة ما تخفض UTs.
وفي الوقت نفسه ، تعتمد سبائك الألومنيوم على علاج الحلول متبوعة بالشيخوخة (تصلب هطول الأمطار) ، حيث تتشكل رواسب دقيقة وعرقلة حركة الخلع لتحسين UTS.
عيوب وخلع
تؤثر العيوب داخل المادة على UTS. يمكن للكثافة العالية من الخلع أو جزيئات المترسبة الصغيرة أن تعيق التشوه وزيادة UTS (هذه هي الطريقة التي تعمل بها العمل وبعض السبائك). ومع ذلك ، فإن العيوب الكبيرة مثل الفراغات أو الشقوق أو الادراج تعمل كمركبات للإجهاد التي تقلل من UTS. بشكل عام ، تميل الشبكة البلورية النظيف الخالية من العيوب (إلى جانب عيوب التعزيز المسيطر عليها) إلى ارتفاع UTS.
درجة حرارة
درجة حرارة التشغيل لها تأثير قوي. تصبح معظم المواد أضعف في درجات الحرارة المرتفعة (تتحرك الذرات بحرية أكبر وتضعف الروابط) ، لذلك تنخفض UTs مع الحرارة. على سبيل المثال ، ينخفض النيكل عالي النقاء من حوالي 550 ميجا باسكال في درجة حرارة الغرفة إلى 350 ميجا باسكال عند 500 درجة مئوية. على العكس من ذلك ، فإن تبريد المعدن (وصولاً إلى Subzero أو درجات الحرارة المبردة) عادة ما يزيد من UTS (على الرغم من أنه قد يصبح أكثر هشاشة).
أمثلة على قوة الشد النهائية للمواد المختلفة
فيما يلي نطاقات UTS النموذجية للعديد من المواد الهندسية الشائعة:
مادة (سبيكة/حالة)
UTS (MPA)
الصلب الكربوني المعتدل (A36)
400-550
الصلب العالي الكربون (1090)
696-950
الفولاذ المقاوم للصدأ (304/18-8)
510-620
الألومنيوم (6061-T6)
290-310
الألومنيوم (7075-T6)
510-538
التيتانيوم (TI-6AL-4V)
900-950
النحاس (نقي ، 99.9 ٪)
200-250
النحاس (C260)
345-485
تطبيقات قوة الشد النهائية (UTS)
يعد UTS مؤشرًا رئيسيًا عند تقييم مدى ملاءمة المادة للتطبيقات الهيكلية والميكانيكية والسلامة الحرجة. فيما يلي بعض مجالات التطبيق النموذجية حيث تلعب UTS دورًا مهمًا:
الهندسة الهيكلية
في الجسور والمباني والبنية التحتية المدنية الأخرى ، تساعد UTS المهندسين على تحديد القدرة على حمل الحمل لحزم الصلب ، حديد التسليح ، والعناصر الهيكلية الأخرى. يستخدم المهندسون بيانات UTS لتأكيد أن المواد يمكنها تحمل أقصى أحمال الخدمة بهوامش أمان كافية.
الفضاء
تتطلب جسم الطائرة والأجنحة والسحابات مواد ذات UTS عالية لمقاومة أحمال الشد مع بقاء الوزن الخفيف. يتم اختيار مواد الفضاء الفضائية مثل سبائك الألومنيوم عالية القوة ، وسبائك التيتانيوم ، ومركبات ألياف الكربون جميعها بناءً على تصنيفات UTS.
السيارات
تعتمد أجزاء السيارات ، بما في ذلك إطارات الهيكل ومكونات التعليق ، على UTS لضمان الجدارة والمتانة تحت الأحمال الديناميكية. يتم اختيار الفولاذ عالي القوة والسبائك الخفيفة الوزن عادة لهذه التطبيقات.
أوعية الضغط وخطوط الأنابيب
المواد ذات UTs الكافية أمر حيوي لأوعية الضغط وخطوط الأنابيب ، التي تحمل الغازات أو السوائل تحت ضغط داخلي مرتفع ، مما يساعد على منع التمزق أو التسرب. تستخدم معايير مثل غلاية ASME ورمز وعاء الضغط UTS كمعلمة تصميم مفتاح.
المنتجات الاستهلاكية والسحابات
حتى في المنتجات اليومية ، تساعد UTS المهندسين على تحديد مواد للمسامير والمسامير والينابيع والمباني البلاستيكية ، للتأكد من عدم فشلهم أثناء الاستخدام المتكرر أو التحميل الزائد العرضي.
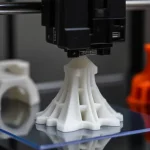
العوامل الرئيسية التي تؤثر على UTS من الأجزاء المطبوعة ثلاثية الأبعاد
إن UTS من الأجزاء المطبوعة ثلاثية الأبعاد متغيرة أكثر بكثير من تلك الموجودة في المكونات المقولبة أو المزورة التقليدية لأن الخصائص الميكانيكية متباينة بطبيعتها في بناء طبقة تلو الأخرى. على وجه الخصوص ، يكون التصاق الطبقة البينية أضعف من قوة داخل الطبقة ، وهذا التصاق يعتمد على العديد من العوامل: درجة حرارة البثق ، وسرعة الطباعة ، وعلاج المادة أو سلوك المعالجة ، وتوجه البناء. الفحص التالي ، تدرس كيفية تأثير كل معلمة على أداء الشد وتحديد أفضل الممارسات.
درجة حرارة البثق
يحدد مدى جودة الصمامات للخيوط المودعة حديثًا مع الطبقة الموجودة أسفلها. إذا كانت درجة الحرارة منخفضة للغاية ، فلن يذوب الشعيرة بشكل كافٍ ، مما يؤدي إلى ضعف التدفق والفجوات الصغيرة في واجهة الطبقة البينية. إذا كان مرتفعًا جدًا ، فقد يتحلل البوليمر أو يصبح سائلًا بشكل مفرط ، مما يسبب الميزات المتدلية أو المتوترة أو المشوهة.
أفضل الممارسات:اضبط درجة حرارة الفوهة في الطرف العلوي من نطاق المعالجة الموصى بها من الشعيرة ، وعادة ما يكون حوالي 5 درجات مئوية فوق نقطة الانصهار الاسمية ، ثم قم بإجراء تجارب خطوة صغيرة (+5 درجة مئوية) لتحديد درجة حرارة الترابط المثلى.
سرعة الطباعة
يتحكم في وقت مسكن المادة الساخنة على الطبقة السابقة. يمكن أن تؤدي السرعات السريعة إلى ترسب "بارد" لا يختلط تمامًا ؛ سرعات بطيئة للغاية يمكن أن تسخن الميزات والتشوه.
أفضل الممارسات:سرعة التوازن والتدفق - استخدم معدل سفر معتدل يسمح لكل حبة بالبقاء فوق انتقال زجاجي للبوليمر (أو عتبة العلاج) لفترة كافية للتنصيب ، دون التسبب في النقط أو التوتر.
ريولوجيا المواد أو سلوك المعالجة
في البلاستيك الحراري مثل PLA و ABS و PETG ، يذوب اللزوجة التي تملي مدى تدفقات الشعيرة والكفح في الطبقة السابقة-ذوبان اللزوجة التي تعزز الترابط بين الطبقة البينية القوية ولكن يمكن أن تساوم الدعم والتفاصيل المتداخلة. في عمليات البوليمر الضوئي ، كيمياء الراتنج (نوع المونومر ، الوزن الجزيئي) وعمق علاج تركيز تركيز التركيز الضوئي وكثافة الوصلة المتقاطعة ؛ التعرض غير الكافي يؤدي إلى ضعف التصاق طبقة.
أفضل الممارسات:اختر خيوط ذات تدفق الذوبان الأمثل (على سبيل المثال ، PETG على PLA القاسية) أو الراتنجات التي تم صياغتها خصيصًا للالتصاق بالطبقة القوية ؛ الحفاظ على مواد الرطوبة جافة للحفاظ على الريولوجيا متسقة.
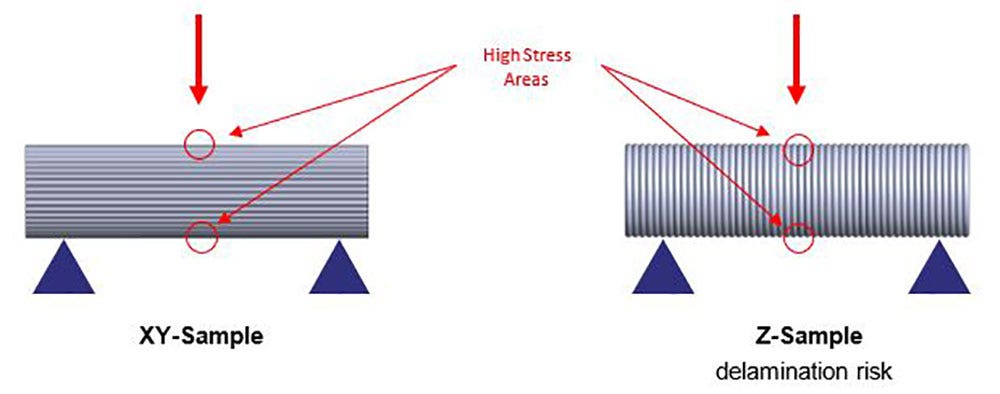
بناء الاتجاه
الالتصاق بين الطبقة الداخلية أضعف من الروابط داخل الطبقة ، لذلك UTS هو الأعلى في طائرات X/Y ولكنه ينخفض بشكل كبير على طول محور Z.
أفضل الممارسات:قم بمحاذاة اتجاه الحمل الأساسي بالتوازي مع طبقات الطباعة وتجنب تطبيق أحمال الشد الرئيسية عبر واجهات الطبقة كلما أمكن ذلك.
ضع في اعتبارك:
يمكنك استخدام FEA للتنبؤ بتوزيع الإجهاد و UTS قبل الطباعة ، ولكن الدقة تعتمد على العملية: إنها موثوقة للطرق المتناحية القريبة - الكثيفة ، (مثل المعادن PBF) ولكن أقل من ذلك بالنسبة للبلاستيك FDM/FFF بسبب تباين الخواص والفراغ المجهري.
يختلف الأداء الفعلي أيضًا مع الطابعة والبيئة ودُفعات المواد - تتمتع طابعات 3D بتكرار أقل من الطرق التقليدية. لذلك ، إلى جانب المحاكاة ، قم بتنفيذ مراقبة العمليات القوية ، والتحقق من المواد ، واختبار ما بعد الإنتاج. بالنسبة لأجزاء السلامة أو الموثوقية الكارثة ، تعد اختبارات الشد المادية إلزامية لتأكيد UTS ومنع فشل غير متوقع.
خاتمة
من بين التطبيقات الهندسية التي لا حصر لها ، تعتبر قوة الشد النهائية (UTS) معلمة حرجة في تقييم المواد ومقارنتها. من فهم تعريفها إلى إتقان طرق الاختبار والحساب ، يمكّن الفهم الصلب من UTS المهندسين من تصميم منتجات أكثر أمانًا وأقوى وأكثر كفاءة.
مع خبرتنا فيتصنيع CNCوالطباعة ثلاثية الأبعاد ، نقدم المكونات التي تلبي باستمرار مواصفات UTS الخاصة بك ، بحيث تحصل على القوة والأداء الذي تحتاجه.اتصل بنا اليوم!
التعليمات
1. ما هو الفرق بين تشوه البلاستيك والتشوه المرن؟
تشوه مرن قابل للعكس ؛ تعود المادة إلى شكلها الأصلي بعد إزالة الحمل. تشوه البلاستيك دائم. بمجرد أن يتجاوز الإجهاد قوة العائد ، إعادة ترتيب الروابط الذرية ، وتبقى المادة مشوهة حتى بعد التفريغ.
2. ما هو الفرق بين قوة العائد و UTS؟
قوة العائد هي الإجهاد الذي ينتقل فيه المادة من السلوك المرن إلى السلوك البلاستيكي - Beyond هذه النقطة ، ويبدأ التشوه الدائم (البلاستيكي). قوة الشد النهائية (UTS) هي الحد الأقصى للضغط الذي يمكن أن يتحمله المادة قبل الانهيار.
3. كيف يختلف إجهاد الشد عن قوة الشد؟
الفرق الوحيد هو أن قوة الشد تشير إلى الحد الأقصى من الإجهاد الذي يمكن للمادة تحمله قبل التكسير ، في حين يصف الإجهاد الشد نسبة القوة المطبقة إلى منطقة مستعرضة في أي مستوى تحميل معين.
4. ما هو الفرق بين الإجهاد الهندسي والإجهاد الحقيقي؟
الإجهاد الهندسي هو القوة المقسومة على المساحة المقطعية الأصلية للعينة ، بغض النظر عن أي تغييرات أثناء التشوه. يتم حساب الإجهاد الحقيقي باستخدام المنطقة المستعرضة الفورية (الفعلية) مع تشوه العينة ، مما يعطي مقياسًا أكثر دقة للإجهاد ، وخاصة في السلالات الكبيرة.
5. ما هو الفرق بين قوة الكسر وقوة الشد؟
قوة الشد (UTS) هي الحد الأقصى للضغط الهندسي الذي تصل إليه المادة على منحنى الإجهاد والضغط. قوة التمثيل (أو قوة التمزق) هي الإجهاد الهندسي الذي تنكسر فيه العينة فعليًا.
في مواد الدكتايل ، يقلل الابتعاد بعد UTS من منطقة الحمل (بينما لا يزال يستخدم المنطقة الأصلية) ، وبالتالي فإن قوة الكسر تقل عن UTS. في المواد الهشة ، مع عدم وجود ضئيل ، فإن قوة الكسر تساوي بشكل أساسي UTS.