तनाव और तनाव दो सबसे महत्वपूर्ण अवधारणाओं में से दो हैं जो यह बताते हैं कि सामग्री बलों को कैसे प्रतिक्रिया देती है। तनाव लोड के तहत एक सामग्री के भीतर प्रति यूनिट क्षेत्र आंतरिक बल है, जबकि तनाव उस सामग्री के आकार में विरूपण या परिवर्तन है जो लागू बल से परिणाम होता है।
हालांकि, तनाव और तनाव के बीच संबंध सिद्धांत से बहुत आगे निकल जाता है - यह ध्वनि इंजीनियरिंग निर्णयों के लिए आवश्यक है। उनकी तुलना में एक साथ, हम बेहतर भविष्यवाणी कर सकते हैं कि सामग्री कैसे प्रदर्शन करती है, वे कितना सुरक्षित रूप से विकृत हो सकते हैं, और जब वे विफल हो सकते हैं। यह लेख उनकी परिभाषा, अंतर, संबंध और व्यावहारिक अनुप्रयोगों की पड़ताल करता है।
इससे पहले कि हम विवरण में जाएं, आपको तनाव और तनाव पर यह छोटा परिचयात्मक वीडियो मिल सकता है:
तनाव क्या है?
तनाव प्रति यूनिट क्षेत्र में आंतरिक बल है जो एक सामग्री एक बाहरी भार का विरोध करने के लिए विकसित होता है। माइक्रोस्कोपिक रूप से, एप्लाइड लोड इंटरटोमिक बलों को प्रेरित करता है जो विरूपण का विरोध करते हैं और संरचना को एक साथ "पकड़ "ते हैं; यह आंतरिक प्रतिरोध वह है जिसे हम तनाव के रूप में मापते हैं।
लोड को कैसे लागू किया जाता है, इसके आधार पर, तनाव को वर्गीकृत किया जाता है:
तन्य तनावटी) और संपीड़ित तनाव (σसी):ये सामान्य तनाव हैं जो क्रॉस-सेक्शनल क्षेत्र के लंबवत कार्य करते हैं।
कतरनी तनाव (τ):क्रॉस-सेक्शनल क्षेत्र के समानांतर कार्य करने वाली स्पर्शरेखा बलों के कारण।
टॉर्सनल स्ट्रेसटी):टॉर्क या ट्विस्टिंग से प्रेरित कतरनी तनाव का एक विशिष्ट रूप।
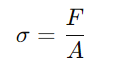
उनमें से, तन्यता तनाव इंजीनियरिंग डिजाइन में सबसे मौलिक प्रकार का तनाव है। गणना सूत्र है:
कहाँ:
σ = तनाव (पा या n/m k; कभी -कभी psi)
एफ = लागू बल (एन)
A = मूल क्रॉस-अनुभागीय क्षेत्र जिस पर बल लागू होता है (m ()
सामग्री का तनाव कैसे मापा जाता है
तनाव को सीधे मापना संभव नहीं है, इसलिए इसके बजाय, हमें लागू बलों या परिणामी विकृति को मापना चाहिए। नीचे प्रमुख माप तकनीकों का एक संक्षिप्त अवलोकन है:
विधि / प्रौद्योगिकी
सिद्धांत
माप उपकरण / उपकरण
सटीकता और परिशुद्धता
सामान्य अनुप्रयोग
सार्वभौमिक परीक्षण मशीन)
उपाय बल (एफ), तनाव की गणना = एफ/ए
एकीकृत लोड सेल के साथ UTM
★★★★★ (उच्च सटीकता)
मौलिक सामग्री परीक्षण: तनाव-तनाव घटता, यांत्रिक संपत्ति मूल्यांकन
विकृति प्रमापक
माप तनाव (ε), σ = E · ε के माध्यम से तनाव की गणना करता है (रैखिक लोच मानता है)
स्ट्रेन गेज, डेटा अधिग्रहण प्रणाली
★★★★ ☆ (उच्च)
घटक तनाव विश्लेषण; थकान मूल्यांकन; एम्बेडेड संरचनात्मक निगरानी
एक्सटेन्सोमीटर
गेज-लंबाई परिवर्तन को मापता है, ε और σ की गणना करता है
संपर्क या गैर-संपर्क एक्सटेंसोमीटर
★★★★ ☆ (उच्च)
नमूनों का तन्य परीक्षण; लोचदार मापांक और उपज तनाव का सत्यापन
अंकीय छवि सहसंबंध
ऑप्टिकल विधि, पूर्ण-क्षेत्र की सतह विकृति को ट्रैक करता है
हाई-स्पीड कैमरा सिस्टम, डीआईसी सॉफ्टवेयर
★★★★ ☆ (पूर्ण-क्षेत्र)
पूर्ण-क्षेत्र तनाव विश्लेषण; दरार ट्रैकिंग; सामग्री अमानवीय अध्ययन
अल्ट्रासोनिक तनाव माप
तनाव के तहत सामग्रियों में तरंग वेग परिवर्तन का उपयोग करता है
अल्ट्रासोनिक जांच और रिसीवर
★★★ of (मध्यम)
अवशिष्ट तनाव का पता लगाना; वेल्डेड जोड़ों और बड़ी संरचनाओं में तनाव की निगरानी
एक्स-रे विवर्तन (एक्सआरडी)
आंतरिक तनाव के कारण होने वाली जाली विरूपण को मापता है
XRD डिफ्रेक्टोमीटर, विशेष सॉफ्टवेयर
★★★★ ☆ (उच्च सटीकता; सतह परतों के लिए स्थानीय)
पतली फिल्में, वेल्डिंग क्षेत्र, धातुओं और सिरेमिक में सतह अवशिष्ट तनाव
फ़ोटोलेसिटी
पारदर्शी birefringent सामग्री में ऑप्टिकल हस्तक्षेप के माध्यम से तनाव की कल्पना करता है
ध्रुवीकृत प्रकाश सेटअप और birefringent बहुलक मॉडल
★★★ of (गुणात्मक से अर्ध-मात्रात्मक)
शैक्षिक डेमो; पारदर्शी मॉडल में प्रायोगिक तनाव विश्लेषण
माइक्रो/नैनोस्केल लक्षण वर्णन तकनीक
EBSD, माइक्रो-रमन, नैनोइंडेंटेशन जैसी तकनीकें माइक्रो- या नैनोस्केल स्ट्रेन/स्ट्रेस मैपिंग प्रदान करती हैं
इलेक्ट्रॉन या लेजर-आधारित सिस्टम, छवि विश्लेषण सॉफ्टवेयर
माइक्रोइलेक्ट्रॉनिक, पतली फिल्में, नैनोइंडेंटेशन, समग्र इंटरफ़ेस व्यवहार
क्या तनाव है?
तनाव सापेक्ष विरूपण का एक उपाय है जब एक बाहरी बल के अधीन होने पर एक सामग्री गुजरती है। यह एक यूनिटलेस मात्रा के रूप में या प्रतिशत के रूप में व्यक्त किया जाता है, जो मूल लंबाई (या आयाम) में लंबाई (या अन्य आयामों) में परिवर्तन का प्रतिनिधित्व करता है।
तनाव का प्रकार लागू तनाव से मेल खाता है: तन्यता तनाव, संपीड़ित तनाव, या कतरनी तनाव।
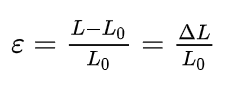
सामान्य तनाव का सूत्र है:
कहाँ:
ϵ = तनाव (आयामहीन या %में व्यक्त)
ΔL = लंबाई में बदलें
एल0= मूल लंबाई
सामग्री का तनाव कैसे मापा जाता है
तनाव को मापने के लिए विभिन्न तरीकों का उपयोग किया जा सकता है। सबसे अधिक इस्तेमाल की जाने वाली तकनीकें स्ट्रेन गेज और एक्सटेंसोमीटर हैं। नीचे दी गई तालिका सामग्री में तनाव को मापने के लिए सामान्य तरीकों को संक्षेप में प्रस्तुत करती है:
तरीका
संवेदन सिद्धांत
सेंसर / ट्रांसड्यूसर
माप परिदृश्य
टिप्पणी
विकृति प्रमापक
प्रतिरोध परिवर्तन
पन्नी-प्रकार का तनाव गेज
स्थिर या कम-आवृत्ति तनाव; आमतौर पर इस्तेमाल हुआ
उद्योग में व्यापक रूप से उपयोग किया जाता है; कम लागत; चिपकने वाली बॉन्डिंग और वायरिंग कनेक्शन की आवश्यकता है
एक्सटेन्सोमीटर
विस्थापन
क्लिप-ऑन / संपर्क एक्सटेंसोमीटर
सामग्री परीक्षण; पूर्ण-खंड माप
उच्च सटीकता; गतिशील परीक्षणों या अत्यधिक स्थानीयकृत तनाव के लिए अनुपयुक्त
अंकीय छवि सहसंबंध
ऑप्टिकल ट्रैकिंग
कैमरा + धब्बेदार पैटर्न
पूर्ण-क्षेत्र तनाव मानचित्रण; दरार प्रसार; जटिल आकार के नमूने
गैर-संपर्क; 2 डी/3 डी विरूपण मानचित्रण; महंगी प्रणाली
पीजोइलेक्ट्रिक सेंसर
पीजोइलेक्ट्रिक प्रभाव
पीज़ोइलेक्ट्रिक फिल्म या क्रिस्टल
गतिशील तनाव, दबाव, प्रभाव, कंपन
उच्च आवृत्ति प्रतिक्रिया; स्थैतिक तनाव माप के लिए अनुपयुक्त
फाइबर ब्रैग झंझरी (एफबीजी)
ऑप्टिकल (ब्रैग प्रतिबिंब)
एफबीजी ऑप्टिकल फाइबर सेंसर
लंबी दूरी पर वितरित या मल्टीप्लेक्स माप
ईएमआई के लिए प्रतिरक्षा; एयरोस्पेस, ऊर्जा और स्मार्ट संरचनाओं के लिए उपयुक्त
लेजर डॉपलर वाइब्रोमीटर (एलडीवी)
डॉपलर प्रभाव
एलडीवी लेजर जांच
गतिशील तनाव/वेग माप और सतह कंपन विश्लेषण
गैर-संपर्क; उच्च संकल्प; महँगा; सतह की स्थितियों के प्रति संवेदनशील
तनाव बनाम तनाव में महत्वपूर्ण अंतर
नीचे एक त्वरित तालिका है जो एक सीधा अवलोकन प्रदान करती है:
पहलू
तनाव
छानना
FORMULA
σ = एफ / ए
ε = ΔL / l₀
इकाइयों
पीए (एन/एमआर), या पीएसआई (एलबीएफ/इन in)
आयामहीन या %
कारण
बाह्य बल
तनाव के कारण विरूपण
प्रभाव
बाहरी भार का मुकाबला करने के लिए आंतरिक बलों को उत्पन्न करता है; यदि बहुत अधिक उच्च
सामग्री की ज्यामिति को बदलता है; लोचदार सीमा में पुनर्प्राप्त, उपज बिंदु से परे स्थायी
व्यवहार
प्रति क्षेत्र आंतरिक बल जिसे एक सामग्री का विरोध करना चाहिए। वितरण के आधार पर, यह संपीड़न, तनाव, झुकने या मरोड़ का कारण बन सकता है
वर्णन करता है कि लागू तनाव के तहत सामग्री कितनी विकृत है; लोचदार या प्लास्टिक हो सकता है
तनाव और तनाव एक दूसरे से कैसे संबंधित हैं
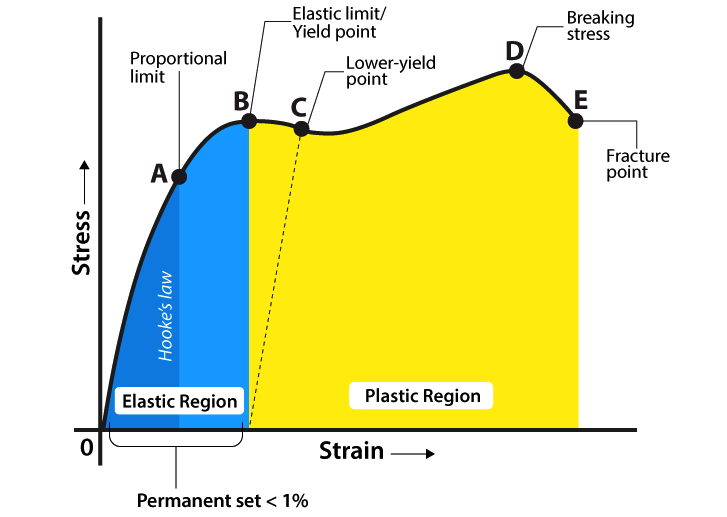
तनाव तनाव का कारण बनता है। एक तनाव-तनाव वक्र ग्राफ करता है कि कैसे एक सामग्री धीरे-धीरे बढ़ती लोड के तहत बढ़ती है जो लागू तनाव के खिलाफ तनाव (विरूपण) की साजिश रचती है। आइए इसके प्रमुख बिंदुओं की समीक्षा करें:
1। लोचदार क्षेत्र (बिंदु ओ -बी)
रैखिक क्षेत्र (ओ-ए):हुक के नियम के बाद तनाव और तनाव पूरी तरह से आनुपातिक हैं। यह रैखिक भाग आनुपातिक सीमा पर समाप्त होता है, और इसका ढलान लोच (यंग के मापांक) का मापांक है, जो सामग्री की कठोरता को दर्शाता है। इस सीमा के भीतर, विरूपण पूरी तरह से लोचदार है: एक बार लोड को हटा देने के बाद, सामग्री अपने मूल आकार में लौट आती है।
(Nonlinear क्षेत्र A-B):सामग्री अभी भी elastically व्यवहार करती है - अर्थात, विरूपण पूरी तरह से पुनर्प्राप्त करने योग्य है, लेकिन संबंध नॉनलाइनर हो जाता है, जिसका अर्थ है कि हुक का कानून अब लागू नहीं होता है। प्वाइंट बी को इसलिए लोचदार सीमा के रूप में जाना जाता है: यह अधिकतम बल का प्रतिनिधित्व करता है जो सामग्री इलास्टिक रूप से झेल सकती है, और क्षेत्र को लोचदार क्षेत्र कहा जाता है।
2। प्लास्टिक क्षेत्र (बिंदु बी आगे)
उपज (बी-सी):प्वाइंट बी के बाद, सामग्री प्लास्टिक क्षेत्र में प्रवेश करती है और विरूपण स्थायी हो जाता है। प्वाइंट बी को ऊपरी उपज बिंदु के रूप में भी जाना जाता है, जहां अव्यवस्थाएं अचानक उनकी बाधाओं से मुक्त हो जाती हैं, इसलिए आवश्यक भार संक्षिप्त रूप से गिरता है, यहां तक कि सामग्री तक खिंचाव जारी रहता है। तनाव तब बिंदु C- निचले उपज बिंदु पर गिरता है, जिस पर तनाव का स्तर लगभग स्थिर रहता है जबकि सामग्री एक स्थायी (प्लास्टिक) तरीके से लम्बी रहती है।
ध्यान दें कि स्पष्ट "अपर → लोअर" यील्ड पठार (बी → सी) कम कार्बन स्टील्स में सबसे स्पष्ट है। अन्य मिश्र धातु अक्सर एक स्पष्ट तनाव डुबकी के बिना प्लास्टिक विरूपण में अधिक सुचारू रूप से संक्रमण करते हैं।
तनाव सख्त (C -D):प्वाइंट सी के बाद, सामग्री का काम कठोर होता है: जैसे -जैसे अव्यवस्थाएं जमा होती हैं और बातचीत करती हैं, धातु का प्रतिरोध आगे के प्रवाह में बढ़ जाता है। यद्यपि यह खंड पतला और लम्बी है, विरूपण के लिए बढ़ता प्रतिरोध इंजीनियरिंग तनाव को तब तक चलाता है जब तक कि यह बिंदु डी पर अधिकतम तक नहीं पहुंचता है-अंतिम तन्यता ताकत(यूटीएस)। यह उच्चतम लोड है जो मूल गेज अनुभाग परीक्षण स्थितियों के तहत बनाए रख सकता है।
गर्दन और फ्रैक्चर (d -e):प्वाइंट डी से परे, स्थानीयकृत गर्दन शुरू होती है, जिससे एक क्षेत्र में क्रॉस-अनुभागीय क्षेत्र में तेजी से कमी आती है। एक इंजीनियरिंग तनाव-तनाव वक्र में, रिकॉर्ड किया गया तनाव तब सामग्री की लोड-ले जाने की क्षमता में गिरावट के रूप में गिरता है। आखिरकार गर्दन वाला क्षेत्र अब लोड को बनाए नहीं रख सकता है, और बिंदु ई पर नमूना फ्रैक्चर करता है। ई पर तनाव विफलता पर सामग्री के कुल बढ़ाव का प्रतिनिधित्व करता है।
यंग का मापांक क्या है?
ओ और ए के बीच लोचदार क्षेत्र के भीतर, तनाव और तनाव के बीच आनुपातिक संबंध यंग के मापांक द्वारा परिभाषित किया गया है, जिसे लोच या तन्यता मापांक के मापांक के रूप में भी जाना जाता है। यह मान हुक के नियम के माध्यम से एक सामग्री की कठोरता को निर्धारित करता है:
ई = तनाव / तनाव
गणितीय रूप से, अर्थात्:
E = σ / ε
जहां ई यूनिट पीए या एन/एम 2 के साथ यंग का मापांक है। मापांक जितना अधिक होता है, किसी दिए गए तनाव के तहत एक सामग्री विकृत होती है।
विभिन्न सामग्रियों में तनाव और तनाव के उदाहरण
विभिन्न सामग्री उनके अद्वितीय तनाव -तनाव व्यवहार के कारण लोड के तहत अलग -अलग प्रतिक्रिया करती है। नीचे कुछ उदाहरण हैं जो इसे व्यवहार में दिखाते हैं:
भवन निर्माण में स्टील
उच्च-वृद्धि वाली इमारतों में, संरचनात्मक स्टील आई-बीम और कॉलम मृत और लाइव लोड के कारण संपीड़ित तनाव ले जाते हैं (डिजाइन तनाव अक्सर लगभग 250 एमपीए तक सीमित होते हैं)। 200 GPA के एक युवा मापांक के साथ, उपज पर संबंधित लोचदार तनाव केवल 0.125% (ε = σ/E) है। उपज बिंदु से परे, हल्के स्टील स्ट्रेन-हर्डेंस और फ्रैक्चर (अंतिम तन्यता शक्ति 400-550 एमपीए) से पहले 10-20% के प्लास्टिक उपभेदों को बनाए रख सकते हैं। व्यवहार में, इंजीनियर 1.5 और 2 के बीच एक सुरक्षा कारक का उपयोग करते हैं, बकलिंग या स्थायी विरूपण को रोकने के लिए 150 एमपीए से नीचे काम करने वाले तनाव रखते हैं।
विमान संरचनाओं में एल्यूमीनियम
एल्यूमीनियम मिश्र जैसे कि 2024-T3 और 7075-T6 का अनुभव तन्य और संपीड़ित तनाव के दौरान 300 MPa तक टेकऑफ़, लैंडिंग और अशांति के दौरान होता है। 70 GPA का उनका मापांक 0.4-0.5%के लोचदार उपभेदों का उत्पादन करता है, एक ही तनाव में स्टील का लगभग तीन गुना। ये मिश्र धातु 500-600 एमपीए की उच्च अंतिम ताकत और 10-15%की कुल बढ़ाव प्रदान करते हैं। थकान जीवन (10⁶ और 10⁷ चक्रों के बीच) को सेवा जीवन पर स्थायित्व सुनिश्चित करने के लिए तनाव आयाम और दरार-विकास दरों की निगरानी करके प्रबंधित किया जाता है।
कार के टायरों में रबर
रबर कार के टायर तनाव और संपीड़न के बार -बार चक्र से गुजरते हैं क्योंकि वे सड़क की सतह के खिलाफ घूमते हैं और विकृत होते हैं। रबर यौगिकों में 15-25 एमपीए और कम लोचदार मोडुली (1-10 एमपीए) की तन्यता ताकत होती है, लेकिन 300-600% के प्रतिवर्ती उपभेदों (कुछ उच्च-प्रदर्शन योगों को 1 000% से अधिक) प्रदर्शित करता है। यह बड़ा पुनर्प्राप्त करने योग्य विरूपण टायर को सड़क की अनियमितताओं के अनुरूप और झटके को अवशोषित करने की अनुमति देता है। डिजाइनर लंबे समय तक स्थायित्व और कर्षण सुनिश्चित करने के लिए लाखों लोड चक्रों के तहत विस्कोलेस्टिक हिस्टैरिसीस (ऊर्जा हानि) और थकान दरार वृद्धि पर भी विचार करते हैं।
निष्कर्ष
तनाव-तनाव घटता प्रमुख यांत्रिक गुणों को प्रकट करता है-लोचदार मापांक, उपज शक्ति, अंतिम तन्यता ताकत, लचीलापन और क्रूरता-कि गाइड सामग्री चयन। यह विश्लेषण करके कि तनाव कैसे वितरित करता है और तनाव को प्रेरित करता है, इंजीनियर विकृति की भविष्यवाणी करते हैं और सत्यापित करते हैं कि घटक लोचदार क्षेत्र में सुरक्षित रूप से रहते हैं, उपज या बकलिंग जैसी सीमाओं के खिलाफ जाँच करते हैं।
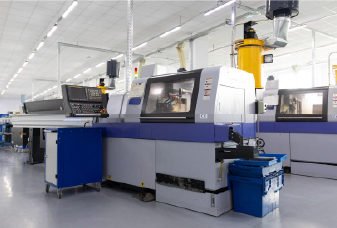
चिग्गो में, हम उन्नत के साथ गहरी सामग्री विशेषज्ञता को जोड़ते हैंसीएनसी मशीनिंगअपने डिजाइनों को जीवन में लाने में मदद करने के लिए। हमारी टीम आपके विश्वसनीय साथी के रूप में आपकी सबसे कठिन परियोजनाओं का समर्थन करने के लिए तैयार है - जिस तरह से हर कदम पर गुणवत्ता और दक्षता को कम करना है।अधिक सीखने के लिए आज ही हमसे संपर्क करेंतू
उपवास
1। इंजीनियरिंग तनाव और सच्चे तनाव के बीच क्या अंतर है?
इंजीनियरिंग स्ट्रेन की गणना केवल मूल गेज लंबाई से विभाजित लंबाई में परिवर्तन के रूप में की जाती है, यह मानते हुए कि गेज की लंबाई लगभग स्थिर रहती है। सच्चा तनाव, इसके विपरीत, नमूना की लगातार बदलती लंबाई के सापेक्ष प्रत्येक छोटी लंबाई परिवर्तन को ट्रैक करता है और पूरे विरूपण प्रक्रिया के दौरान इन वृद्धिशील उपभेदों को एकीकृत करता है। छोटे विकृति के लिए, दोनों लगभग बराबर हैं। लेकिन जैसे -जैसे विरूपण बढ़ता है, इंजीनियरिंग तनाव वास्तविक परिवर्तन को कम करके आंका जाता है, जबकि सही तनाव एक सटीक उपाय प्रदान करता है।
2। क्या लचीलापन कठोरता के समान है?
नं। कठोरता, यंग के मापांक द्वारा निर्धारित, लोचदार विरूपण (तनाव-तनाव वक्र की ढलान) के लिए सामग्री का प्रतिरोध है। लचीलापन प्रति यूनिट वॉल्यूम की वसूली योग्य ऊर्जा है जो सामग्री उस लोचदार रेंज (उपज तक वक्र के तहत क्षेत्र) में अवशोषित कर सकती है।